
Help document

Copyright © RATA Co. 2021-2025
1.
Table of Contents
3.1.1.
Read or Create CAD Files
According to Plant BOM
3.1.2. Visualize The Family Tree
3.1.3.
Create Family Tree Chart in
Excel
3.1.4. Definition of Processes
3.1.5.
Creation of Process Sheet
Drawings
3.1.6.
Validation of Drawings by
Tracking the Changes in Process Plan
4.1.1.1. Parent Children Excel Sheet Format
6.1.1. Import From Catia BiW Fastening
6.1.3. Process Excel File Format
6.1.3.4. Resolving Panel Ambiguity
6.2.1.1. Create BiW Fastening Options
6.3. Generate Drawing Sheet(s)
6.3.1.
Process Sheet Creation Dialogue
Box
6.3.1.3. Selection of stations
6.3.1.4. Selection by Panel (Pairs)
6.3.1.6. Selection by Process ID
6.3.1.7. Sheet Template Selection
6.3.1.10. Create Drawing Button
6.3.3.
Partial View Extent Adjustment
in CATIA
6.3.4.
Partial View Extent Adjustment
in Crop Window
6.6.3. Define and Edit a Standard
7.1. Create Tree Chart in Excel
7.2.1. Context Menu of the Node List
7.3.1.
Context Menu of Component List
Viewer
7.4.1.
Context Menu of Process List
Viewer
7.5.2. Show and Hide Obsolete Drawings
7.5.3.
Context Menu of the Drawing List
Viewer
8.1.3. Drawing Sheet Templates Tab
8.1.3.1. Drawing Names Pattern
8.1.3.3. Manage Process Sheet Templates
8.1.3.4. Process Sheet Templates format
8.1.4. Process Sheet Options Tab
8.1.4.2. Selected Process Table Items
8.1.4.3. Drawing Extent Adjustment
8.1.4.4. Process Indication Arrows
8.1.5. Process to CAD Options Tab
8.1.5.2. Curved Process Colors
8.1.5.3. Process Shape File Type Option
8.1.5.4. Insertion of Shape Options
8.1.5.5.
Insertion of BiW Fastening
Options
8.1.6. Process General Options Tab
8.1.6.1. Process Incorporation Options
9.2.3. Tree View Settings Menu
9.6.4. Drawing Management Buttons
9.6.4.4.
Locate File in the Drawings
Folder
2.
Introduction
BIW-AP is a software aimed to assist in planning the assembly process in BiW production lines. It helps in visualizing the product family tree and parts assembly sequence, modifying assembly sequence, automatic creation of assembly CATIA product files, planning the production processes like spot welding, sealing etc., adding the defined processes to CATIA files and automatic generation of workshop drawings.
3.
Overview
3.1. Program Functions
3.1.1.
Read or Create CAD Files
According to Plant BOM
BIW-AP program is
intended to create/manage CAD files and process shop drawings of projects of
planning a BiW assembly line. If The CAD files of the
family tree are already created according to the Plant BOM (Manufacturing Bill
of Material) the program can start a project by reading the Plant BOM structure
from the existing CAD files. Otherwise, it can create the CAD files according
to the planned assembly sequence of Plant BOM.
3.1.2. Visualize The Family Tree
Once the Plant BOM is defined
in the program, it visualizes the family tree of the product and accordingly
the image and information of each assembly station. A visual presentation of the family tree
helps in understanding the Plant BOM and find flaws or possibilities of
improvement in the planned Plant BOM. An example of tree view of a project is
shown in
Figure 3‑1
.
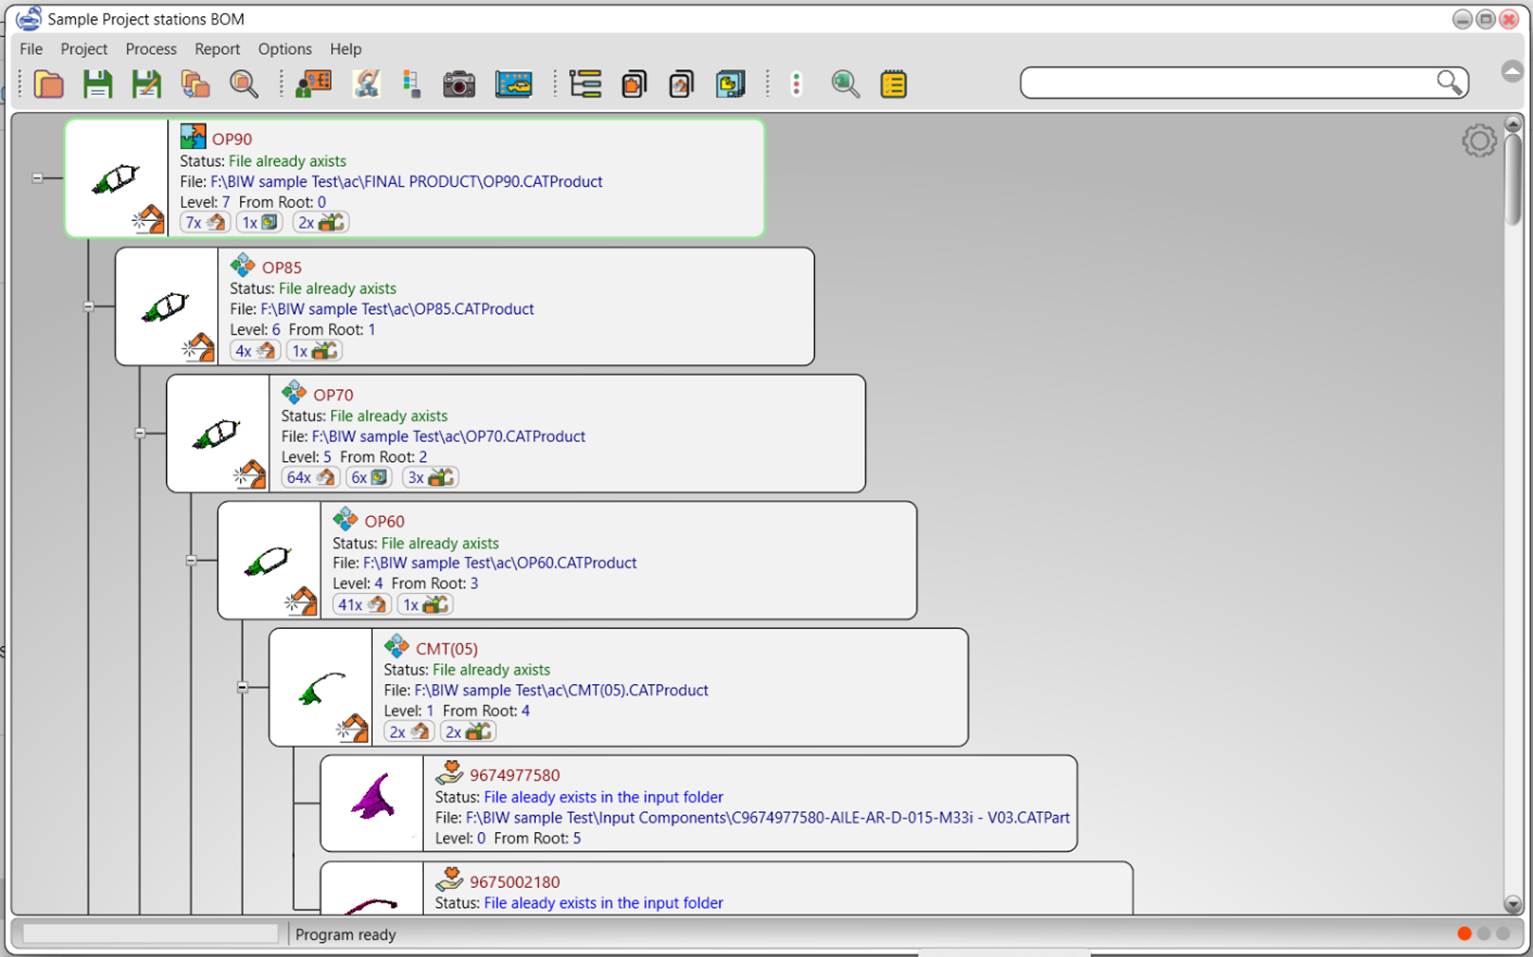
Figure
3
‑
1
A Family Tree View in BIW-AP Program
3.1.3.
Create Family Tree Chart
in Excel
The family tree chart in Excel
which is a typical document in automotive industry for illustration of the BiW assembly plan and is required for communication with
suppliers and different departments is made by the program. Manual creation of
this chart is a cumbersome job which is now made easy as a click by this
program and saves a considerable time in engineering of the BiW
assembly lines. An Example of family tree chart created by BIW-AP is shown in
Figure 3‑2
.
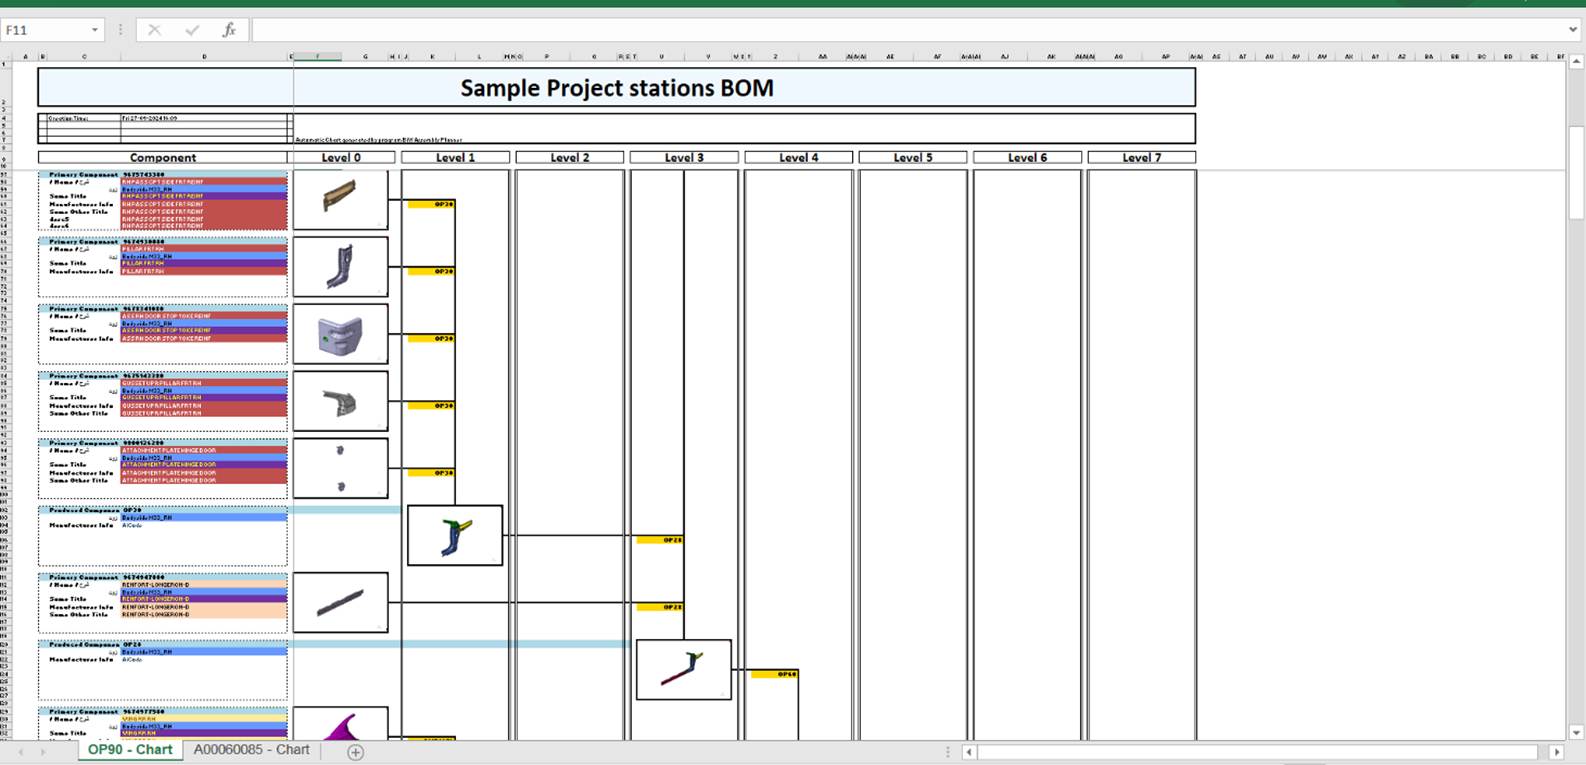
Figure
3
‑
2
An automatic generated family tree Excel chart
3.1.4. Definition of Processes
Manufacturing processes
at each station of the assembly line can be defined in the program either by
importing from a excel file or reading from BiW
Fastening definition in Catia CAD Files.
3.1.5. Creation of Process Sheet Drawings
Process drawings are one
of the goals of engineering of BiW assembly lines.
These drawings are needed for programing the tools and teaching the robots and
training of the production personnel. These drawings are also needed as
documents needed for repair and maintenance of the BiW
lines during the production life cycle.
Since the construction
and production technicians are the main users of the process drawings, and
these people usually have no access to expensive software like Catia, the
process drawings are preferred to be made in general software like Excel to be
available to the users, and also be editable by them to keep them handy and
updated during the product life cycle.
Creation of process
drawings is a meticulous, cumbersome and exacting job which is very prone to
mistakes. The BIW-AP program makes the creation of drawings as easy as a click
for dozens of drawings. The drawings are created both in Excel and PDF
documents. A sample of automatic in excel created process drawings is shown in
Figure 3‑3
.

Figure
3
‑
3
Samples of automatic generated
process drawings
3.1.6.
Validation of Drawings by
Tracking the Changes in Process Plan
It is a tremendous job to keep them updated
during the Plant BOM planning and keep track of changes in the process in
drawings. This program keeps the drawings continuously updated and warns if any
changes in stations or process definitions invalidate any of drawings. The changes in the drawing validations
automatically and immediately reflect in the listing and reports. Invalidated
drawings, appear with a warning sign (
⚠️) in the listing reports.
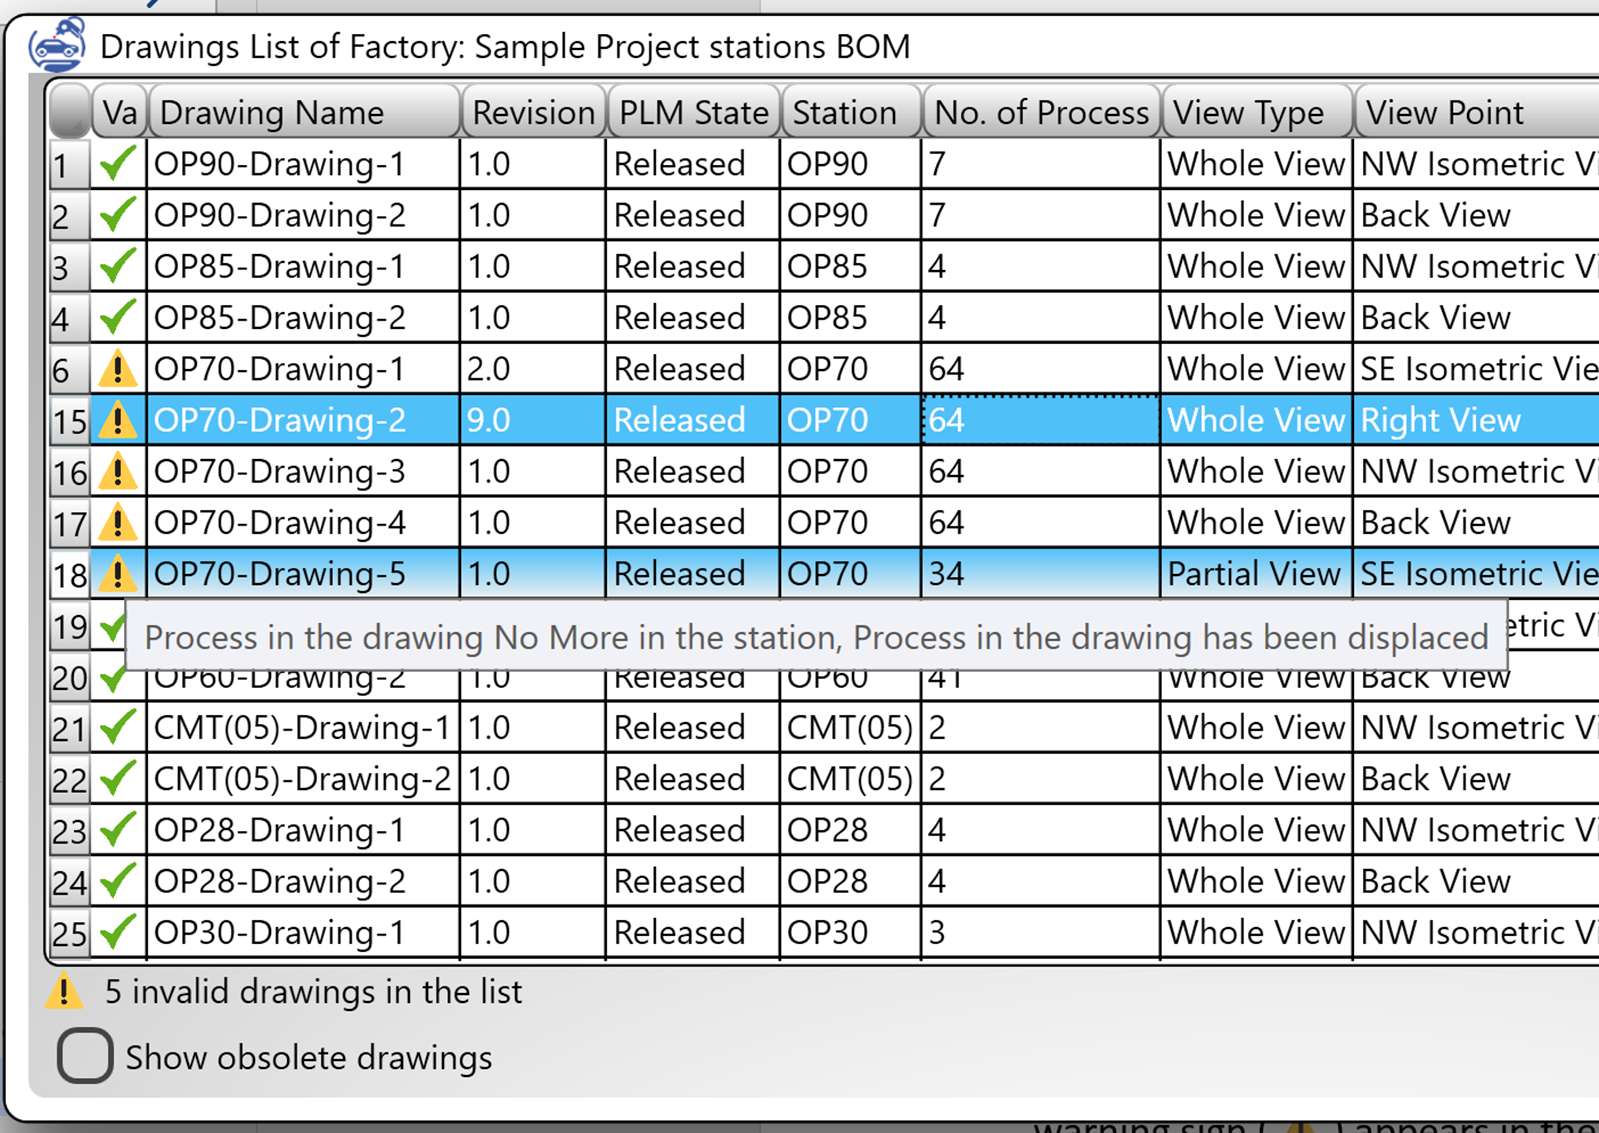
Figure
3
‑
4
Invalidated Drawing in a
listing report
3.1.7. Movability
The program updates its
data with the existing files in the project folder. Therefore, just copying the
files or drawing folder to the folder of a new project is enough for
transferring the data or synchronizing the data with the new project. Of
course, the data will be checked for consistency and validation when they are
loaded to the project.
3.2. Program User Interface
The program interface
provides visual facilities for viewing project data and performing desired task
on the project.

Figure 3 ‑ 5 Program Interface
3.2.1. Data View Area
Data view area is the
largest part of the program window. In the data view area of the program the
family tree structure of components produced in the BiW
assembly line is shown. Each station in the BiW line
comprises a node in the tree which gives a brief overview of the station
information in a bubble. On the left side of the bubble a picture of the
assembled component in the station is shown if available. More details of each
station can be seen by adjusting the setting in the view settings menu. The view
settings menu pops up when clicking on the gear sign (
![]() )
on the top right side of the data view area. A glimpse of the Data View Area is
shown in
Figure 3‑5
. Tree viewer details is
explained in section
9.2
.
)
on the top right side of the data view area. A glimpse of the Data View Area is
shown in
Figure 3‑5
. Tree viewer details is
explained in section
9.2
.
3.2.2. Top Menu Bar
The top menu bar of the
program includes menu headers of File, Project, Process, Report, Tools and
help. Each of these menu headers pops a menu with related items. The file menu
includes items for creation of s new project, save and open item and exit the
program.
The project menu includes
items for viewing or manipulating project information and creation of assembly
components.
The process menu includes
items for adding or removing process items to stations in the factory project
and creation of process shop drawings.
The report menu generates
list reports of the project data including reports of components, stations and
process and drawings. The reports are generated in sub windows in the program
but option for export to excel is available if required. One of items in the
report menu also creates the family tree chart in an excel sheet.
In the Tools menu an item
is available for checking the connection to Catia program, and item for
unhiding excel program if excel runs in hidden mode and the options item is
available through this menu which allows adjust program and project settings.
The help menu provides
the instruction of the program including this help document.
3.2.3. Search Bar
A search box appears on
top right side of the program along with the menu bar. This search bar can be
used to find nodes in the family tree view. If the sought node is in a
collapsed branch of the tree the branch is expanded and the found node bubble
is shown as the selected node.
3.2.4. Status Bar
Status bar is the ribbon
on bottom of the program main window. The status bar includes a progress bar
that indicates the progress of the running task of program, the status text
area which shows the messages of the program, and the Catia status indicator
which continuously shows the Catia connection status.
3.2.5. Catia Status Indicator
The Catia status
indicator comprises three big dots on bottom right of the main window. The first dot from left indicates if Catia is
running on the computer. If no instance of Catia is running it is red and the
other two are gray. As soon as an instance of Catia is started on the computer
this first dot turns green and the second dot turns red, which indicates that
Catia is not connected yet. When Catia is fully loaded and BIW-AP program
succeeds in connecting to it, the second dot turns green too.
The last dot on the right
side is green whenever Catia is visible and red if Catia is running in
invisible mode. Some of program operations hide or unhide Catia, but a manual
control is also available in “Catia Status Watcher” window through options menu
(see sec.
8.2
).
3.2.6. Node Types
There are five node types
in product family tree as listed in the
Table 3‑1
:
Table 3 ‑ 1 Node Types
|
Icon |
Node
Type |
Description |
|
|
Factory
Product |
Factory products are the final
products of the BiW Assembly line considered as the
output of the line. A project should have at least one factory product. The
program allows to define more than one factory product. |
|
|
Primary
Component |
Primary component is a component
already produced and fed to the assembly line.
A Primary component appears only
once in the factory product.
A primary Component can be a
body panel with a CATPart type CAD file or a
complex assembled structure in a CATProduct file.
However, if it’s a CATProduct no operation on the
sub parts of it are allowed in the project. If operations on sub parts are
intended then a subassembly node type should be defined for it. |
|
|
Subassembly
Component |
Subassembly component is an
assembly of some parts presented by a CATProduct
CAD file used several times as different positions in the factory product.
Further operations like welding of subassembly panels at the insertion
positions is allowed in the program. |
|
|
Standard
Part |
Standard part is a component
already produced and fed to the assembly line.
Unlike primary components, a
standard part may appear more than once in the factory product.
A primary Component can be a
body panel with a CATPart type CAD file or a
complex assembled structure in a CATProduct file.
However, if it’s a CATProduct no operation on the
sub parts of it are allowed in the project. If operations on sub parts are
intended then a subassembly node type should be defined for it. |
|
|
Subassembly
Instance |
Subassembly instance is a node
in the family tree of the factory product where an instance of a subassembly
is inserted. The ID of the node
comprises the ID of the subassembly followed by its instance number embraced
in “<>”, e.g., “A0050089<1>” |
|
|
Standard
Part Instance |
Standard part instance is a node
in the product family tree where an instance of a standard part in
inserted. The ID of the node comprises
the ID of the standard part followed by its instance number embraced in “<>”,
e.g., “SUDT8x12<1>” |
|
|
Produced
Component |
Produced components are
components that are produced by assembling several other components together
in the BiW assembly line. |
Note:
The nodes of types Factory Product,
Subassembly Component and Produced Component are actually corresponding to
working stations in the BiW Assembly line, hence
called also stations.
The station nodes can
have manufacturing process definitions. i.e., manufacturing processes like spot
welding or other type of welding, addition of adhesives, mechanical joining and
etc. can be defined for station nodes.
4.
File Menu
File Menu provides general functions for staring a new project, opening and closing a project file as well as saving operations.
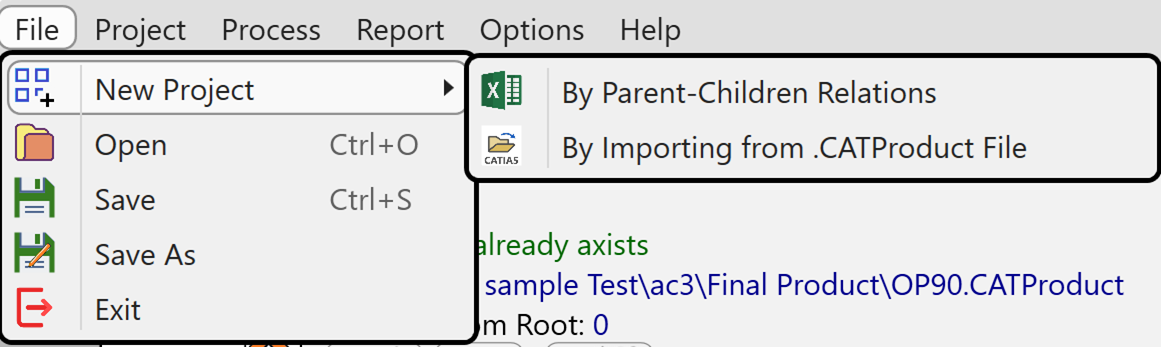
Figure 4 ‑ 1 File Menu
4.1. New project
There are several ways to
start a new project that are included in the new project menu item.
4.1.1. New by Parent Children
In this method the parent-child relations of the
family tree components should be defined in an Excel sheet. By clicking on this
menu item, a new project dialog box as shown in
Figure 4‑2
opens.
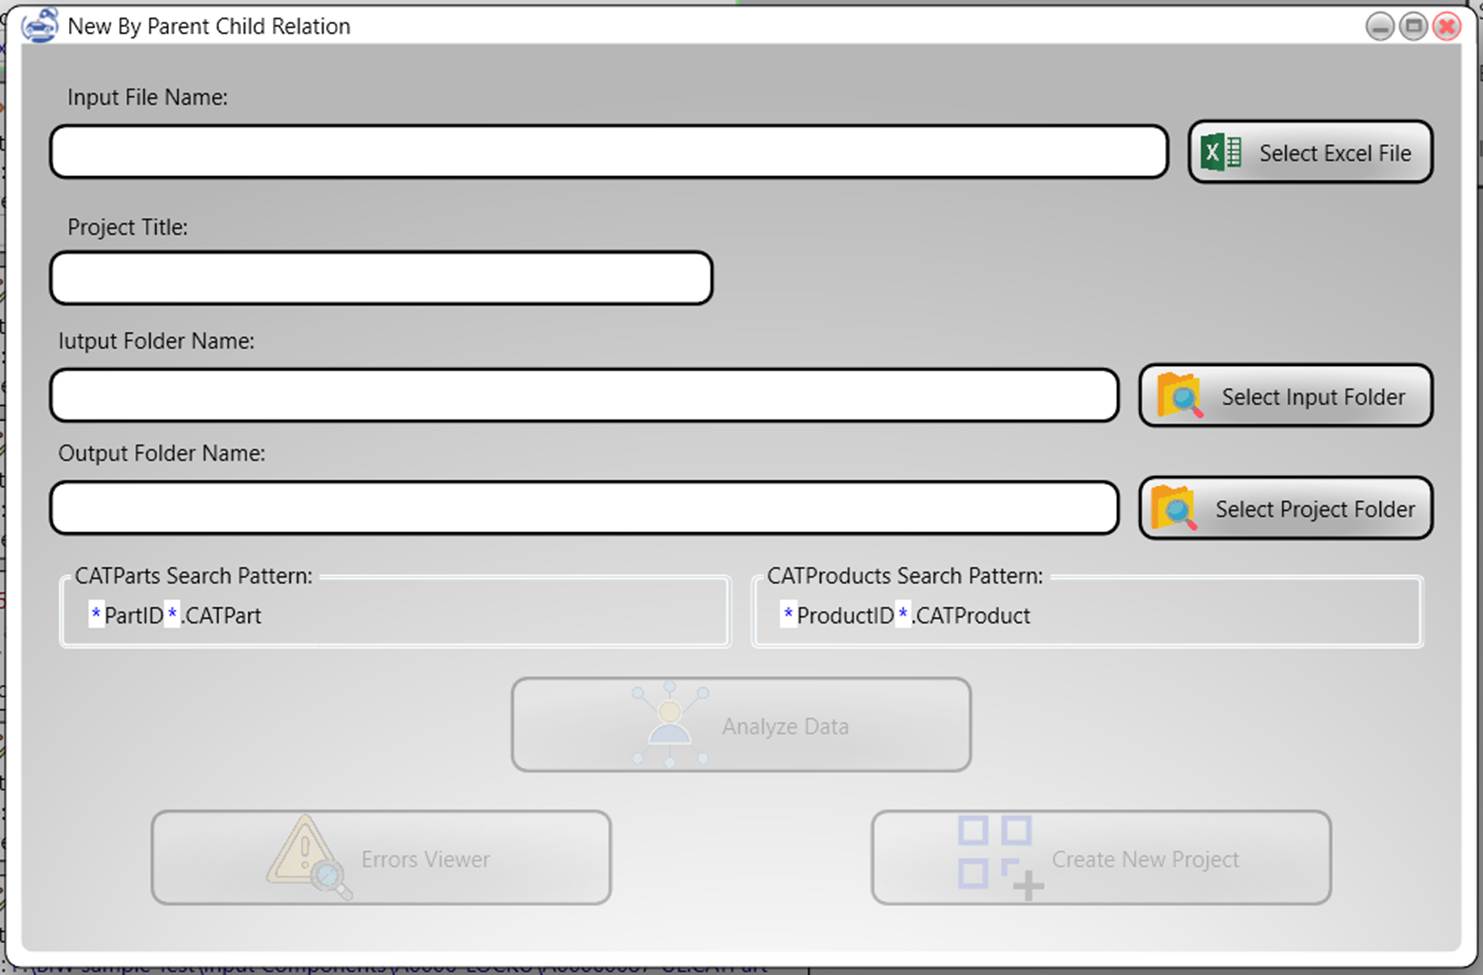
Figure 4 ‑ 2 New By Parent Children Dialogue
In this dialog box there are input fields for entering the Excel file name, two fields for defining the file search pattern for CATPart and CATProduct file types, Input folder in which the Catia files of the product components are stored and a folder as the project folder in which all the files created by BIW-AP Program including assembly files, images and temporary files are stored.
4.1.1.1. Parent Children Excel Sheet Format
The definition sheet should include two columns
with the titles “Parent” and “Child” respectively. A column titled “3D
Position” is optional. Following points should be considered in preparation of
Child-Parent definition excel file:
·
The input sheet should be the first sheet in the Excel workbook.
·
The first row in the excel file that includes both “Parent” and “Child”
cells is considered as the table title row.
·
All rows and data above the table title are ignored by the program. So, the
rows above the table titles can be used for arbitrary notes by user.
·
The table rows need not to be in a sorted order. All the need is the
child-parent relations to be logical and correct, however, for ease of
controlling the accuracy of data it is recommended that the user create the
table in a sorted and classified manner.
·
Any column with a blank cell in the title row will be ignored by the
program.
·
Some properties can be defined for the child components by adding more
columns to the table. For this purpose, the property name should be included
the title row and the property value in the corresponding row of the intended
child. fill and text colors of the property cell are also read and used by the
program as the colors of the property.
·
A sample child-parent sheet is shown in the
Figure 4‑3
.
Figure
4
‑
3
Sample Child Parent Sheet
·
A sample Excel file of child-parent definition can
be retrieved from program from the menu path Tools>Sample Excel Files>Child-Parent
Definition
Child and Parent input formats
The suitable way to
introduce each child or parents can be given chosen from one of different
formats explained in the following table with examples:
Table 4 ‑ 1 Child and Parent input formats
|
Entered
Value |
Example |
Result |
|
ID or Item Key |
AB002556L |
A Catia file corresponding to
the given ID is searched for according to the search pattern. The Search is
done in the “input folder” and the “Project Folder” respectively. |
|
Full file name |
E:\CatiaComponents\PN-AB002556L-Outer.CATPart |
The given file is searched for. |
|
File name |
PN-AB002556L-Outer.CATPart |
The given file name is searched
for in the “input folder” and the “project folder” respectively. |
|
“CATPart”
File name with relative address in CHILD column |
.\Some Subfolder\
PN-AB002556L-Outer.CATPart |
The given file is searched in
the given subfolder respectively in the “input folder” and the “Project
Folder” |
|
“CATProduct”
File name with relative address in PARENT column |
.\Some Subfolder\PN-AB002556L-Outer.CAT.CATProduct |
The given file is searched in
the given subfolder respectively in the “input folder” and the “Project
Folder”. If the component is not found, the subfolder will be created in the
project folder and the assembly file will be created in it. |
|
ID or Item Key with relative
address |
.\Some Subfolder\AB002556L |
A Catia file corresponding to
the given ID is searched for according to the search pattern. The Search is
done in in the given subfolder in the “input folder” and the “Project Folder”
respectively. If The If the component is not a primary component and not
found, the subfolder will be created in the project folder and the assembly
file will be created in it.
|
Note:
In addition to the file address, a color can be
assigned to the child component by assigning a fill color to the child
definition cell. This fill color will be used as the color of the component in
creation of Catia assembly files by the program.
3D Positon input Format
The 3D position of each
component indicates the position and orientation of the child component in the
parent assembly. If the 3D position of a child is left blank the child is
inserted in the assembly CAD file in the same coordinate system as the parent’s
which is usually the Car Coordinate System in the automotive industry.
There are two different
ways for entering the 3D position, by 6 or 12 coordinate components. The
coordinate components are in either way separated by a semicolon “;”.
·
In 6-component format of the 3D position the first three components
indicate the origin of the coordinate system and the three remaining components
indicate the orientation of the coordinate system by three rotation angles
respectively about X, Y and Z axes of the parent coordinate system. i.e., the
coordinate system is given as: “
X; Y; Z; RotX; RotY;
RotZ”
·
In 6-component format, the rotation angels are given in degrees.
·
In 12 component format the coordinates of the unit vectors of the child
coordinate system axes with respect to the parent coordinate system come first
and then the coordinates of the origin of the coordinate system. i.e., the
coordinate system is given as: “Ux
; Uy; Uz;
Vx; Vy; Vz; Wx; Wy; Wz; X; Y; Z”
Hint:
A simple way to extract the position coordinates
of a component in Catia is to open the parent “CATProduct”
file in Catia. Then temporarily apply a “Fix” constraint on the component you
need the coordinates of (i.e., by icon
![]() ).
Now you can open the “Constraint Definition” window of the added constraint by
double clicking on its anchor sign. the 6 coordinate components can be seen in
the opened dialogue box, by clicking on the “More>>” button.
).
Now you can open the “Constraint Definition” window of the added constraint by
double clicking on its anchor sign. the 6 coordinate components can be seen in
the opened dialogue box, by clicking on the “More>>” button.

Figure
4
‑
4
Components of coordinate
system in CATIA
Additional Property Definition
Any desired number of
properties can be defined for the child components by adding more columns to
the table. For this purpose, the property name should be included the title row
and the property value in the corresponding row of the intended child.
·
Fill color and text color of the property cell are also read and used by
the program as the colors of the property.
·
If a row comprises only one of either child or parent (i.e., either Child
cell or parent cell in a row are left blank) the row is considered as a
property definition row. The properties given in the row are attributed to the
given component in the child or parent column.
·
If a property is given more than once for a child the last row definition
is taken by the program.
4.1.1.2. Input folder
If the full file address of a component is not given in the excel sheet, the program first searches for it in the “input folder.” So, the primary components of the product family tree can be placed in a folder and introduced as input folder to the program
4.1.1.3. Project Folder
If a component is not found in the input folder it will be searched for in the “Project Folder” by program. If the component is not found in the project folder it will be created in the project folder.
· In addition to the Catia components, the project folder is where all created data of the project including drawings, images, process components, export files and temporary files will be created in.
· Images of the components will be created in a subfolder named “images” in the project folder
· Process drawings including Excel drawing files, PDF files and Jpeg or PNG files will be created in a subfolder named “BAP DWG” in the project folder.
· Process shapes are created in a subfolder named as the corresponding component file name in the project folder.
· Catia process export files will be created in the project folder with the same file name as the corresponding component with a “.txt” extension.
4.1.1.4. Search patterns
If a child or parent component is indicated by its ID in the Excel sheet, the program searches for them with respect to the given search patterns for “.CATPart” and “.CATProduct”.
· If a component is a primary component or standard component (i.e., it is not mentioned as parent in the family tree), the program searches for both corresponding CATProduct and CATPart for it. However, if a corresponding CATProduct is found the CATPart will be ignored.
· If a component is mentioned in the parent column the program searches only for the corresponding CATProduct.
· If several files corresponding the given ID are found, the files with longest file name will be taken by the program. If all files are of the same length, the conventional comparison will determine the result.
The search patterns can be adjusted according to the “wild card” rules of the operating system, in the corresponding items in the dialogue box.
![]()
Figure 4 ‑ 5 Search Patterns for CATPart or CATProduct files
Some examples of search pattern are given in the Table 4‑2 :
Table 4 ‑ 2 CAD File search pattern examples
|
Pattern |
Result |
|
ID
.CATPart |
A file with the name: “
ID.CATPart
”, for example for a given ID of A0050068
the file A0050068.CATPart will be searched for |
|
*ID*.CATPart |
Any file containing the given ID as part of its name
will be searched for |
|
*ID
.CATPart |
Any file name ending with “
ID.CATPart
” will be searched for |
|
ID*.CATPart |
Any file name with extension “CATPart”,
starting with given ID will be searched for |
|
?ID
.CATPart |
Any file name that has only one letter before ID and
ends with “ID.CATPart”
will be searched for |
|
C ID
.CATPart |
Any file name starting with letter “C” followed by “ID.CATPart” will be searched for |
|
CC ID ee.CATPart |
Any file name starting with “CC” then ID then “EE”
then “.CATPart” will be
searched for |
4.1.1.5. Analyse Button
This button runs an analysis on the child-parent relations in order to figure out the family tree, and also checks the existence of the component CAD files. If any problem is detected in the given data a corresponding warning or error is generated. List of the problems checked for is given in the Table 4‑3 :
Table 4 ‑ 3 Problems checked for in the parent-child definition excel sheet
|
Problem |
Type |
Meaning |
|
No Root |
Error |
Could not find the final product in the excel file.
Possibly the product tree root is involved in a loop. |
|
Infinite Loop |
Error |
The analysis detected that the give child-parent
relations is inconsistent so that, some relations definitions lead an invalid
loop (i.e., some parent is mentioned as child of one of its descendants)
The loop is listed in the errors window like this:
“OP45 ! OP
50
!
OP70 ! OP45”
Where a “!” separates the sequence of child
definitions leading to the loop. |
|
Missing Component |
Warning |
A primary component given as child in the Excel sheet
could not be found. As a result, the parent assembly files will be defected.
The list of missing can be seen by opening the errors
window. |
|
File name discrepancy |
Fatal Error |
Different file names are given for the same component
throughput the parent child definitions table |
|
File Type Invalid |
Error |
Parent components may only be of CATProduct
file type. If the given file name is of CATPart
type this error is generated |
|
Folder Invalid |
Error |
If the given folder for a component does not match
the acceptable format of the operating system this error is generated |
|
Invalid Excel file format |
Error |
A row including “child” and “parent” cells could not
be found in the excel sheet to be considered as the table title |
|
Position Components Not Valid |
Fatal Error |
Position input data is not valid so that program could
not parse position components for child |
|
Component Duplicated |
Fatal Error |
A component is placed at the same position in the
assembly file more than once |
|
Property Row Problem |
Warning |
Duplicate values are given for a property of a
component. The duplicated value is ignored. |
4.1.1.6. Errors Button
After running the analysis on the input data, if any problem is detected this button is activated and the button text changes to reflect the number of warnings and errors. If any errors are detected the button text color turns red. Clicking on this button opens a window listing the problems. An Example of errors window is shown in Figure 4‑6 .
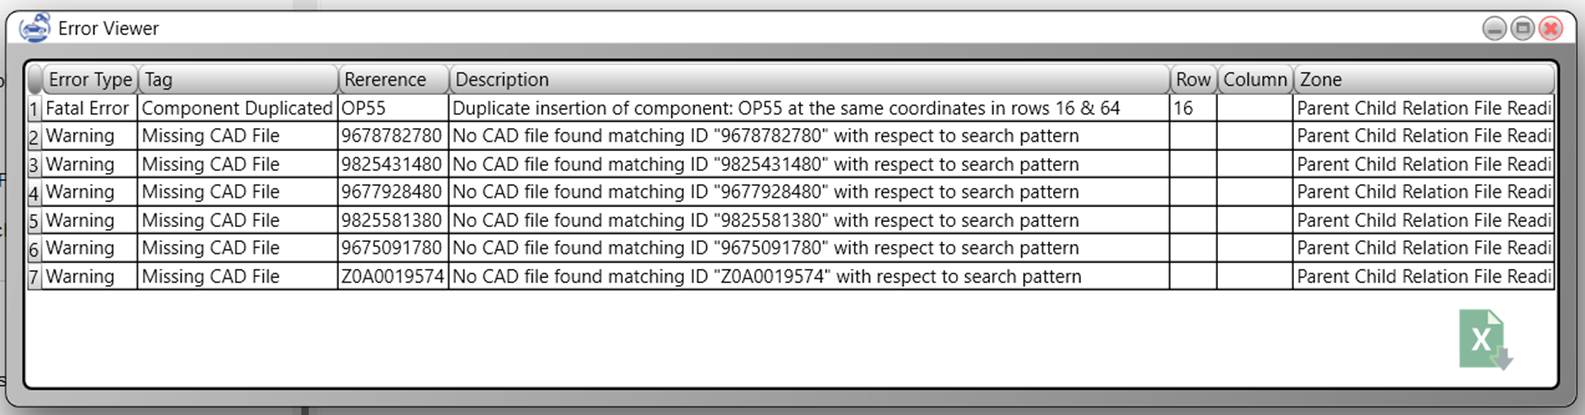
Figure 4 ‑ 6 Example of errors detected in analysis of Child-Parent relatons Excel sheet
4.1.1.7. Create Project
If no errors are detected after analysis of the input data, this button will be activated. By clicking on the “Create a new project” the new project will be created. If there are any warnings detected in the input data, it’s up to the decision of the user to create a new project with imperfect data or not.
The new project gathers more related information from the project folder, like process drawings and component images if available.
4.1.2. New From CATProduct
If a Catia assembly file constructed according the desired family tree is already available, a new BIW-AP project can be started by extracting the family tree from this CATProduct file. The corresponding command is invoked by the menu path “File > New > By Importing from .CATProduct File”.
Clicking on this menu opens a simple dialogue box for selecting the Catia file and entering the project title. This dialogue box is shown in Figure 4‑7 .
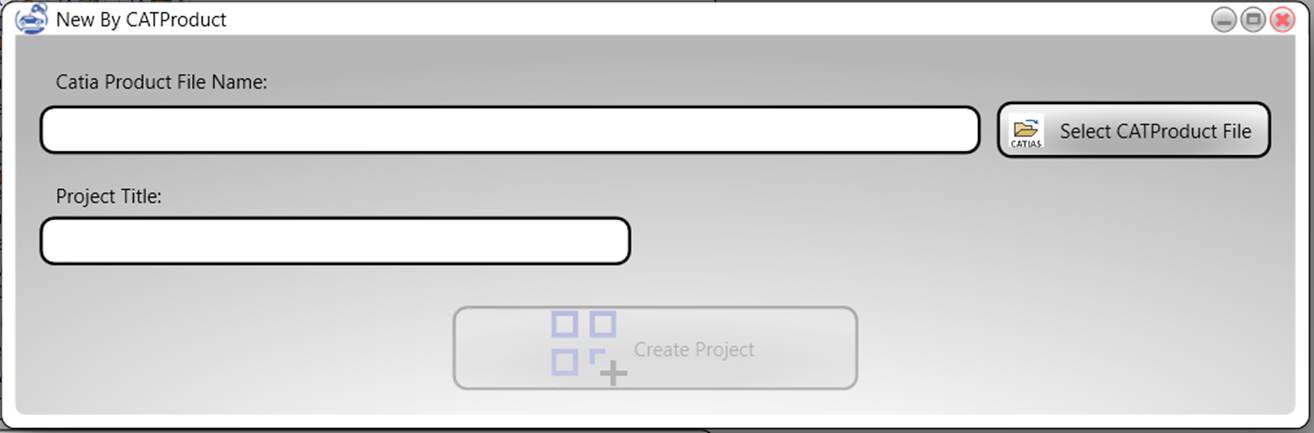
Figure 4 ‑ 7 New by CATProduct dialogue window
By clicking on the create button the new project will be created. If any errors are encountered in creation of the new project a message box prompts for the error and the errors list can be seen in the opening error window.
The new project gathers more related information from the project folder, like process drawings and component images if available.
4.2. Open
By clicking on the open menu
item, a dialogue box pops up for choosing a file with extension BIW-AP. By
choosing the project file the project opens.
The new project gathers more related information from the project folder, like process drawings and component images if available, and updates its own data with the date found in the project folder.
4.3. Save
If the project has
already been saved once this button updates the saved file. And if the file has
not been saved yet it asks for a file name with extension BIW-AP and saves the
project information in it.
4.4. Save as
It opens a dialogue box
to ask a new file name with extension BIW-AP and saves the project in it.
4.5. Exit
This menu item closes the
program. If the current project contains unsaved data or there are running
tasks in the program, it asks for confirmation before exit.
5. Project Menu
Functions for manipulating project data are listed in project menu items.
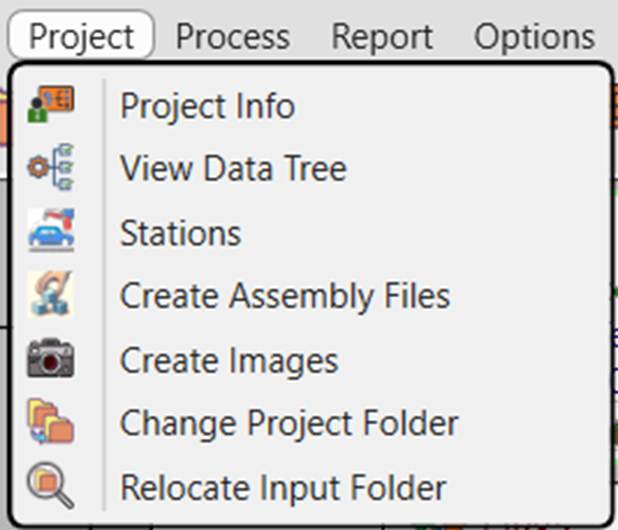
Figure 5 ‑ 1 Project Menu Items
5.1. Project Info
By clicking on project info
menu item, a window opens that shows overall information of the project as
shown in
Figure 5‑2
.
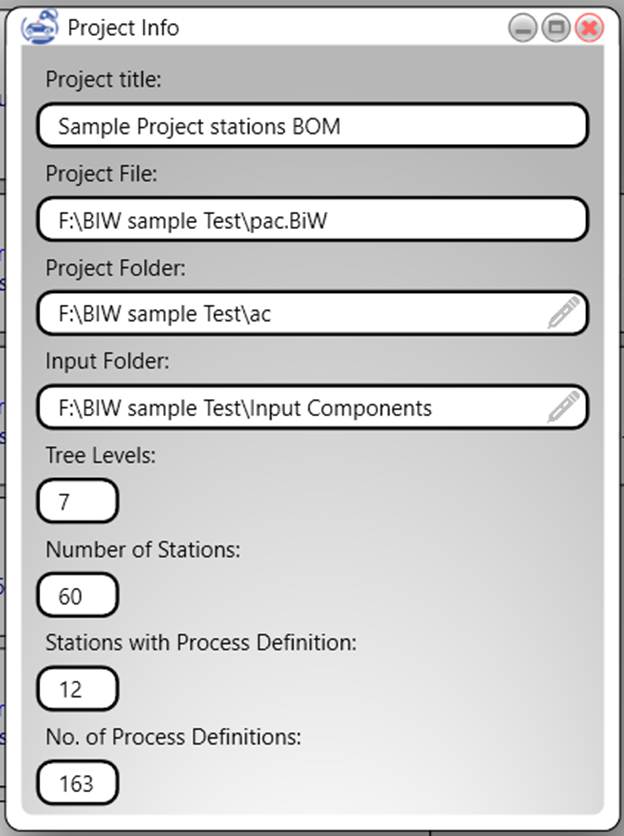
Figure
5
‑
2
Project Info Window
Project title that will
appear in all drawings, can be seen or edited in this window. Project input
folder and output folder addresses are also listed in this window. These folder
addresses can be changed by clicking on the pencil icon on right side of the
folder address text boxes. By choosing a new folder, the project checks for availability
of files in the new folders and updates the project info with the new folder.
5.2. Data tree Viewer
This opens a new window
which provides visualization of the project family tree with the same
capabilities as the data view area of the main window explained in
3.2.1
. This menu item is useful for cases we would like
to work or watch different branches of the family tree at the same time. As many as wished data tree viewers can be
opened if required.
5.3. stations
This menu item opens a
station viewer window in which an overview of information of stations defined
in the project, are shown.
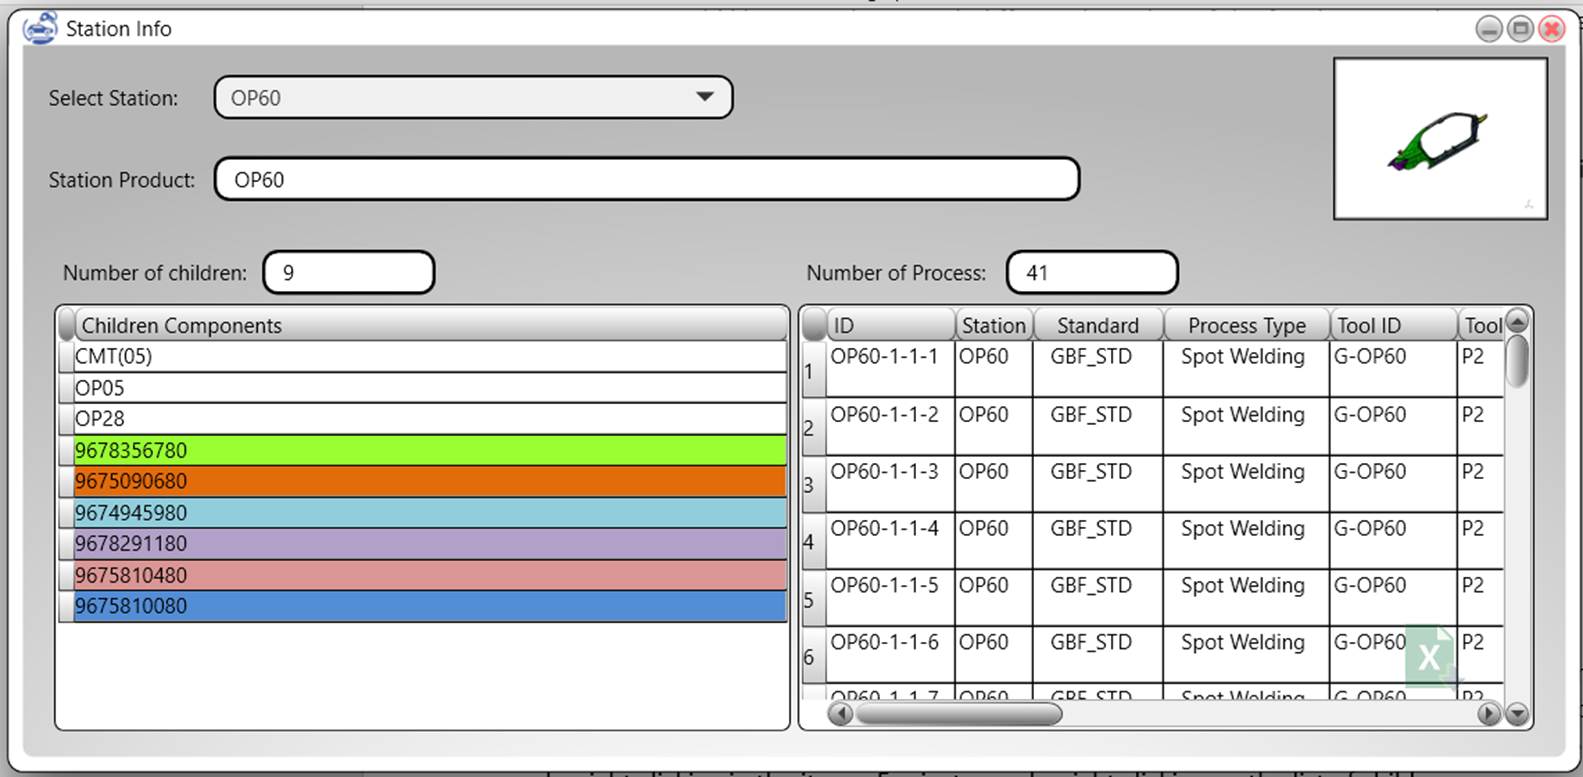
Figure
5
‑
3
Station Viewer
The station viewer window
gives the information about component created in the station including the station
type, file name and component name, list of children components, tools and list
of process definitions. More details of functions available for each of shown
items in the station viewer can be seen by right clicking in the items. For
instance, by right clicking on the list of children components a pop-up menu
opens with the option of seeing details of the component. Or, by right clicking
on the process list the details of each process can be seen.
5.4. Create assembly files
If the assembly files are
not already created, they can be creating through this menu item. If Catia
program is not running on the computer a message box will prompt the user to
run Catia and try again. This function also creates an image of all component
in the family tree.
During creation of the
assembly files and images, Catia remains hidden. However, the progress is shown
in the status bar area. Also, in the data view area, the status of each
corresponding node will change to a green text of “File Created”. Image of each
component appears on the left side of the corresponding bubble immediately
after creation.
5.5. Create Images
This menu item creates an
image for all components in the family tree which have existing CAD files. Each
created image appears on the left side of the corresponding bubble immediately
after creation. The images are also used in creation of the family tree chart
in Excel. The images are created in a subfolder named “Images” in the project
folder.
5.6. Change Project Folder
This menu item allows to
choose a new folder as the project folder. By choosing a new folder, the
project checks for availability of files in the new folders and updates the
project info with the new folder. This option a provides the possibility of
moving the project folder to a different drive or folder on the computer or
working on the same project in different computers.
5.7. Relocate Input Folder
This menu item allows to
choose a new folder as the input folder. By choosing a new folder, the project
checks for availability of files in the new folders and updates the project
info with the new folder This option a provides the possibility of moving the
input folder to a different drive or folder on the computer or working on the
same project in different computers.
6.
Process Menu
This menu provides
functions for defining or modifying BiW processes
jobs to the project information, adding the process information to CAD files
and creation of technical shop drawings for processes.
Figure
6
‑
1
Process Menu
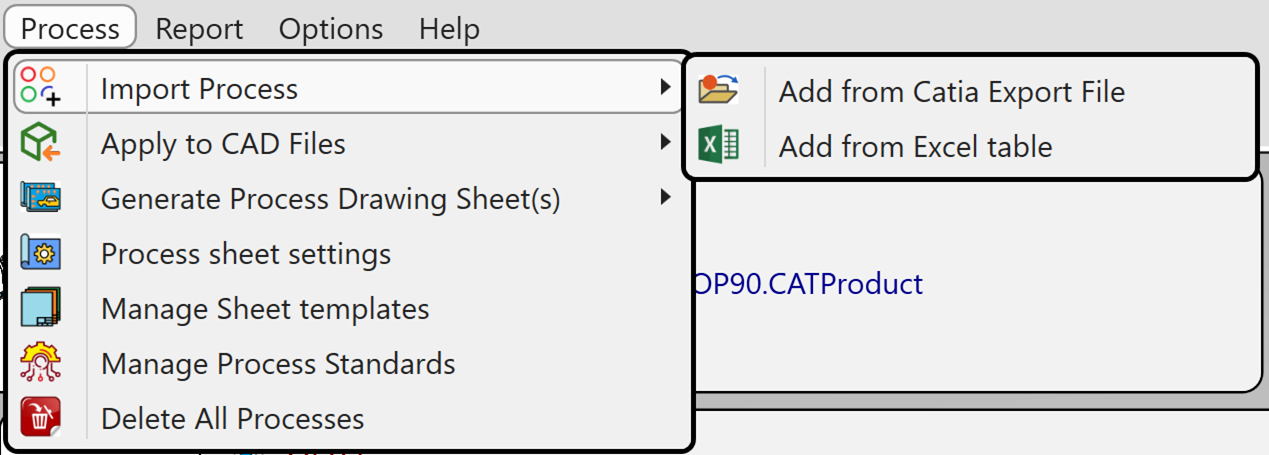
6.1. Import Process
This meu item opens a sub menu providing two methods for importing process definitions into the project data. The “Add from Catia Export File” option allows to import the process definitions from BiW Fastening process definitions in a CATProduct file.
The “Add from Excel table” option allows to import process definition from an Excel sheet. This option uses the advantage of the flexibility of MS Excel sheets to import process definitions from any kind of process definition data base or process definition banks. All required task is to export the process data from process definition bank to an Excel sheet and modify the sheet according to the data format of the BIW-AP process definition table.
After importing processes, an icon of process (
![]() )
appears on the bottom right corner of the image area of the tree node bubble
for stations in which process definitions were imported. By keeping mouse over
this icon for moment, a tooltip bubble pops up in which a brief report of the
process definitions in the station is listed. As shown in
Figure 6‑2
.
)
appears on the bottom right corner of the image area of the tree node bubble
for stations in which process definitions were imported. By keeping mouse over
this icon for moment, a tooltip bubble pops up in which a brief report of the
process definitions in the station is listed. As shown in
Figure 6‑2
.
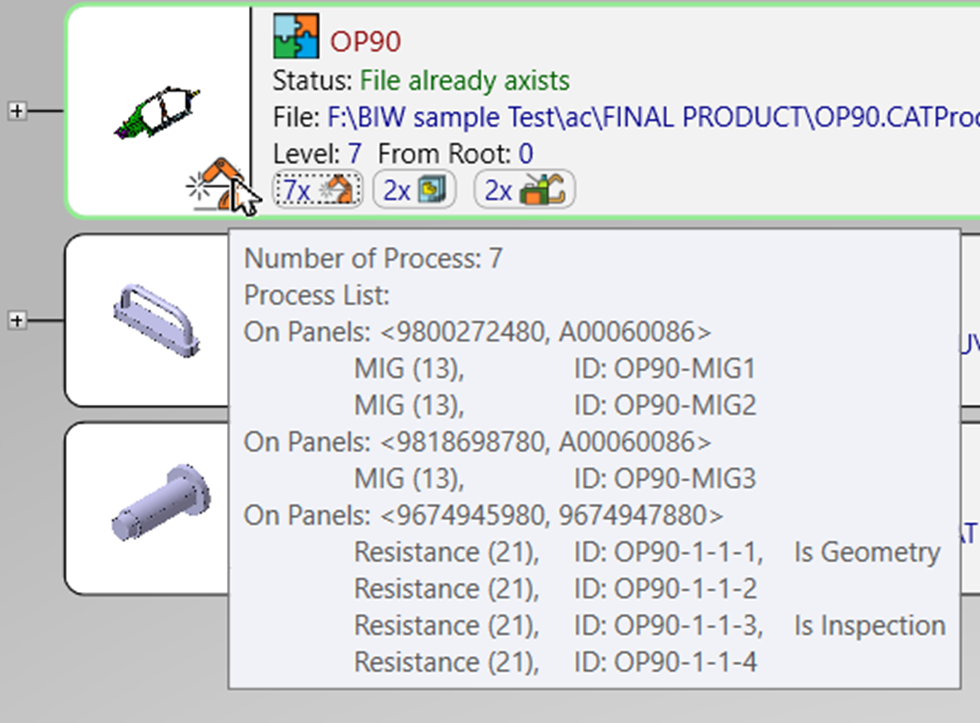
Figure 6 ‑ 2 Process icon and the brief report of process definitions in the staion
Also, two small buttons appear on lower edge of the station info area, which show the number of process and tool definitions in the station ( Figure 6‑3 ). A click on these buttons respectively opens a process list window or tool list window.
![]()

Figure 6 ‑ 3 Processes, Drawings and Tools List Buttons on station info bubble
6.1.1. Import From Catia BiW Fastening
In order to import
process definition from BiW Fastenings in a CATProduct file, the process definitions should be exported
to a text file using export tool in BiW Fastening
module of Catia. The export tool opens a dialogue box in which the user can
assign a file name and indicate the directory in which the export file will be
created. The check box of “Include additional information” should be unchecked
in this dialogue box.
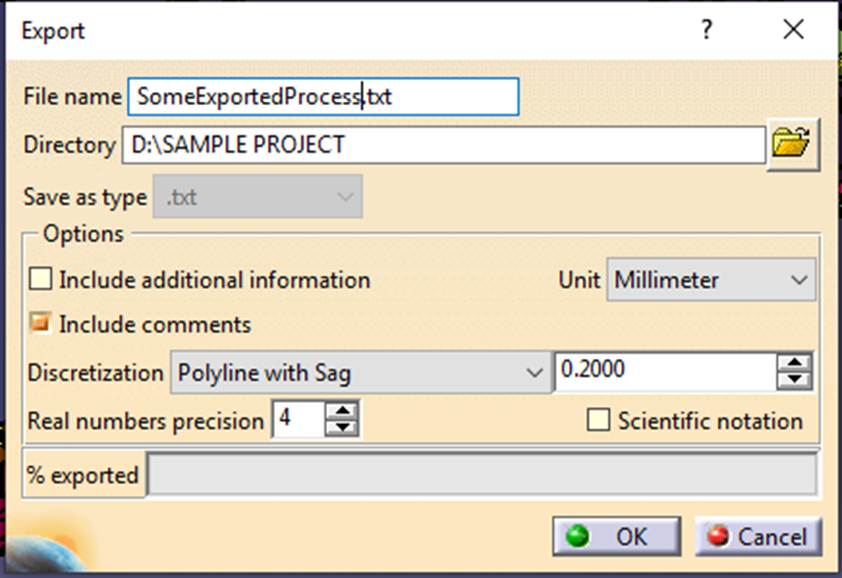
Figure
6
‑
4
Automotive BiW Fastening
export dialog box in catia
After successfully
exporting the BiW Fastening definitions in to a text
file. The user can import the process definitions in to BIW-AP project by
clicking on the “Add from Catia Export File” menu item. The program asks for
the import file and imports the process definitions to the corresponding
station data.
Note:
Uncheck the “Include additional information”
check box.
6.1.2. Import From Excel file
By clicking on this menu
item, the program opens a dialogue box asking for the excel file of process
definitions. The program then reads the excel file and incorporates the process
definitions to the station definitions of the project.
Each row of process
definition in the excel sheet is investigated separately by the program and if
there is no problem in the definition, the process is added to the project
information. Therefore, if there are problems in only some of the process
definitions in the excel file, they do not affect the correct process
definitions and the excel sheet is incorporated partially to the program
information. The program prompts about the number of correctly incorporated
process definition and the number of erroneous rows in the excel sheet as shown
in
Figure 6‑5
.
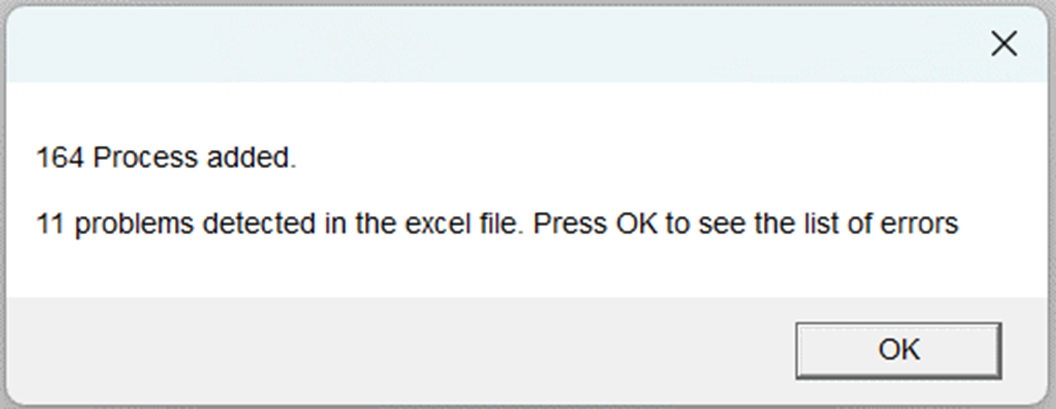
Figure 6 ‑ 5 The program prompt on result of process definition reading from Excel sheet
If any problem is
detected in the process definitions the program opens a report window listing a
report of the detected problems as shown in
Figure 6‑6
.
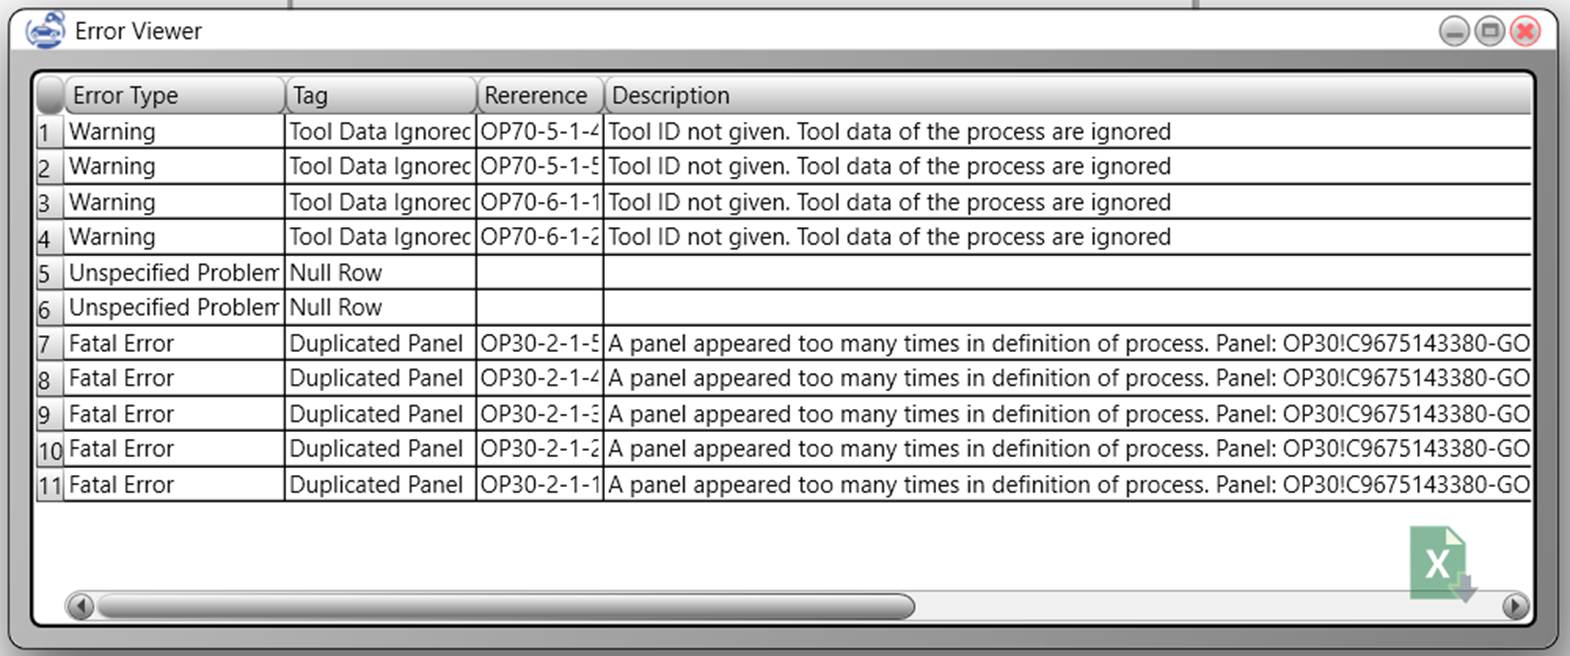
Figure
6
‑
6
Error report of importing process
from Excel file
6.1.3. Process Excel File Format
In order to import data from Excel the process information should be written in a table in the first worksheet of an Excel file with a specific format. The table format contains two rows of table title. The first row of table title holds the main column titles and the second row holds subtitles or default values. The table should contain four mandatory titled columns, but there are several optional table columns that can be added to the table for additional information.
The mandatory titles are listed in Table 6‑1 :
Table 6 ‑ 1 mandatory titles of Process definition table
|
Title |
Meaning |
|
Process/Spot ID |
Each process definition should have a unique
identifier that can be a text, number, or specific characters or combination
of them |
|
Station ID |
The ID of the station in which the process will be
applied on the BiW panels |
|
Panel 1 |
At least one panel is required for definition of a
process, however most of process types usually are applied on a couple of
panels or more. So, definition of a column titled “Panel 1” is mandatory
however more panels can be defined for process by adding columns of “Panel
2”, “Panel 3”, … and so on. |
|
Position(s) |
The X,Y,Z coordinates of
each process. |
In addition to the mandatory columns, some arbitrary can be defined in the process definition tables as listed in Table 6‑2 .
Table 6 ‑ 2 Arbitrary titles of the process definition table
|
Title |
Default Value |
Meaning |
|
Standard |
GBF_STD |
Name of the BiW Fastening standard
definition corresponding to that of Catia |
|
Process Type |
Unspecified |
Type of the process as defined in the standard |
|
Spot Diameter |
4.0 |
Diameter of spot-weldings
or thickness of weldings or other types of process
definitions |
|
Flags |
- |
Flags of a process definitions like Geometry,
Inspection etc. |
|
Tool ID |
- |
ID of the tool assigned for application of the
process |
|
Tool Generic Name |
- |
Generic name of the tool type like welding gun,
welding torch etc. |
|
Tool Generic Type |
- |
Generic type of the tool like X or C for spot welding
guns |
|
Tool Manufacturer |
- |
Manufacturer name or info of the tool |
|
Tool Manufacturer Type Code |
- |
Type Code of the tool in manufacturer standards |
|
Tool Program |
- |
Program ID of the tool for the process |
|
Tool Location Code |
- |
Location of the tool in the factory |
Note: Each table title may include several subtitles in the subtitle row. I case there are more than one subtitle for a table title, the title cell is a merged cell merging the title cells of all subtitle columns.
6.1.3.1. Process/Spot ID
The Process/Spot ID column comprises a single excel sheet column and takes no value in the subtitle row. The IDs of the processes are entered in this column and there is no specific rule for definition of the process IDs. The Process IDs can be a combination of alphabet characters, numbers and special characters. The only rule in this column is that the IDs should be unique.
Note: Please note that the process IDs are CASE SENSITIVE. This means that the program differentiates between capital letters and small letters.
6.1.3.2. Station ID
The station ID should be corresponding to ID of a station already defined in the family tree of the project.
6.1.3.3. Panel
Each Panel column comprises three sub columns with subtitles of “ID/Code”, “Name” and “Thickness”. One of either “ID/Code” or “Name” values is mandatory for definition of a panel. However, the priority is with “ID/Code”. This means if the ID of a panel is given the program ignores the name of the panel.
The given ID should correspond to the ID of a component in the family tree of the project. The “Name” of the panel should correspond to the “Part Number” in the CATPart file of a component in the family tree of the project.
Note: Please note that the “Part Number” of a Catia part is different from the file name. So, it should be carefully extracted from CATPart file by opening the CAD file in Catia and finding the “Part Number” on the root of tree structure or inside the “properties” dialogue box.
Note: if a panel appears more than once in the product tree structure of a component, i.e., in case the panel is a standard component or part of a subassembly repeatedly inserted into the product, definition of the panel requires resolving the ambiguity of the panel under process. By default, the program automatically resolves the ambiguity by finding the instance of panel coinciding with the process position. However, there is an option for explicitly specifying the intended panel in the excel file. The ambiguity resolving is explained in section 6.1.3.4 .
6.1.3.4. Resolving Panel Ambiguity
If a panel appears more than once in the product tree structure of a component, i.e., in case the panel is a standard component or part of a subassembly repeatedly inserted into the product, definition of the panel requires resolving the ambiguity of the under-process panel. By default, the program automatically resolves the ambiguity by finding the instance of panel coinciding with the process position. However, there is an option for explicitly specifying the intended panel in the excel file.
Automatic resolving panel ambiguities
By default, the program automatically resolves the ambiguity by finding the instance of panel coinciding with the process position. In order to resolve the ambiguity, the program first measures the distance of the process location and all instances of the ambiguous panel in the station. The closest panel is then selected as the target of the process.
The panel resolving procedure is a relatively time taking procedure. The program exploits Catia for measuring the distances. Specially in large products the measurements take more time and CPU load. As a rough estimate, in a complete car body model it may take up to two minutes to resolve panel ambiguities for each process definition.
During running of ambiguity resolving, a progress window appears on the screen, showing the progress status in a progress bar. A cancel button on the progress window allows cancelation of the procedure. During execution of the panel resolving functions, the program seems irresponsive due to the heavy CPU usage of CATIA. Therefore, after clicking on the cancel button, please be patient for a minute until after finishing measurements of the current process program responds to your command and cancels the procedure.
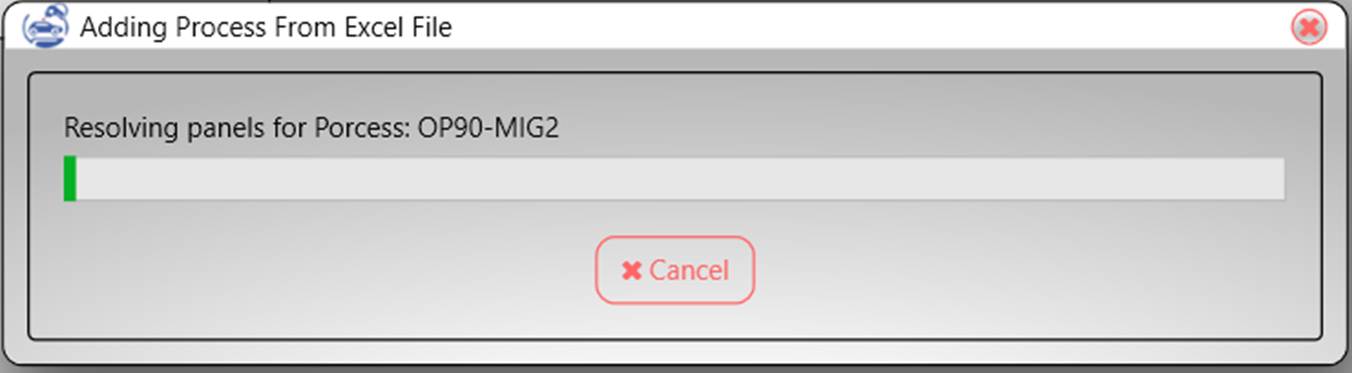
Figure 6 ‑ 7 Panel ambiguity resolving progress window
Regarding the time taking procedure of the automatic panel resolving, an alternative option is available to manually identify the target instances for ambiguous panels, by providing an address clue in the definition of panels in the process definition excel sheets.
Address Clue
Regarding the time taking procedure of the automatic panel
resolving, an alternative option is available to manually identify the target
instances for ambiguous panels, by providing an address clue in the definition
of panels in the process definition excel sheets. If the option of “Prefer
Resolving Panel Ambiguity by Address Clue” in checked in the project options
(See
8.1.6.1
), the program first looks for address clues in panel definitions and uses the
given address clues for resolving ambiguity of the corresponding panels. The
address clue can be added before panel name in the panel name column of the
excel sheet.
The address of the panel,
relative to the station in which the process is defined, comprises the sequence
of tree nodes starting from the station product down to the intended panel. The
address starts with the “Part number” of the station, then an exclamation sign
(i.e., “!”), then the “instance name” of the subsequent node (usually the part
number of the node with a trailing “.1”, “.2” etc. in Catia), then an
exclamation sign, then the instance name and an exclamation sign for the next
node and so on, down to the intended panel’s “instance name”. The panel “Part
Number” should come after the address clue. Below, some examples of panel
address clue definitions are given.
Table 6 ‑ 3 Some examples of address clue definition
|
OP85.1!A00060085-LOCKU.1!A00060086-BAS.1!A00060086-BAS |
|
OP85.1!A00060085-LOCKU.2!A00060086-BAS.1!A00060086-BAS |
|
OP55.1!A00060085-LOCKU.1!A00060086-BAS.1!A00060086-BAS |
Note:
If ambiguous panels have common sequence of nodes
in starting part of their address, the common part of their address can be
ignored. In other words, the minimum address information that clarifies the
ambiguity if enough for definition of the address clue.
6.1.3.5.
Position(s)
The “position(s)” table column
accommodates the place for insertion of X, Y and Z coordinates of as many
points as required for definition of the process. The subtitle row of the
position(s) includes repeated sequences of three columns for X, Y and Z
respectively. For definition of processes that apply to a single spot (i.e.,
spot welding, riveting, clinching etc.) only a single set of X, Y and Z can be
given whereas for processes that apply on curves, such as MIG Welding, a
multitude of at least two sets of X, Y and Z coordinates are required.
6.1.3.6.
Standard
The standard column is
optional. If the table does not contain a standard column the standard of the
process is set to “GBF_STD”, which is equivalent to the default BiW Fastenings standard in Catia.
The default standard of
Catia BiW Fastenings module is predefined in the
program under name of “GBF_STD” with the default process types as those of
default “GBF_STD” standard of Catia. If the BiW
Fastenings standard in Catia is customized or new standards are defined in
Catia, the equivalent standard can be defined or edited in the BiW-AP as explained in sec
6.6
.
6.1.3.7.
Process Type
The “process type” column
is an optional column. In case no process type column is given in the table,
all processes take the first type defined in the standard (“Unspecified” in
case of default standard of “GBF_STD”). If the process type column is added to
the table, a default value can be defined in the subtitle row for the process
type, so that all the process definitions with a blank cell take this default
value.
The predefined process
types in the default “GBF_STD” in the program are listed in table below:
Table 6 ‑ 4 Predefined Process Type Definitions
|
|
Name
|
Acro
|
CATIA
PTYP Name
|
Spot Operation
|
Curve Operation
|
|
1 |
Unspecified 1 |
U1 |
Unspecified 1 |
Spot Defined |
Curve Defined |
|
2 |
Unspecified 2 |
U2 |
Unspecified 2 |
Spot Defined |
Curve Defined |
|
3 |
Spot Welding |
SPW |
Resistance Welding |
Spot Defined |
N/A |
|
4 |
Resistance Welding |
RES |
Resistance Welding |
Spot Defined |
Curve Defined |
|
5 |
TIG |
TIG |
TIG |
Spot Defined |
Curve Defined |
|
6 |
TIG (14) |
TIG14 |
TIG (14) |
Spot Defined |
Curve Defined |
|
7 |
TIG (141) |
TIG141 |
TIG (141) |
Spot Defined |
Curve Defined |
|
8 |
Laser |
LAS |
Laser |
Spot Defined |
Curve Defined |
|
9 |
Unspecified Welding |
UNSW |
Unspecified Welding |
Spot Defined |
Curve Defined |
|
10 |
MIG |
MIG |
MIG |
N/A |
Curve Defined |
|
11 |
MIG (13) |
MIG13 |
MIG (13) |
N/A |
Curve Defined |
|
12 |
MIG (131) |
MIG131 |
MIG (131) |
N/A |
Curve Defined |
|
13 |
Roll Seam |
RSM |
Roll Seam |
N/A |
Curve Defined |
|
14 |
Flash Butt |
FBT |
Flash Butt |
N/A |
Curve Defined |
|
15 |
Resistance Butt |
RBT |
Resistance Butt |
N/A |
Curve Defined |
|
16 |
Brazing |
BRZ |
Brazing |
N/A |
Curve Defined |
|
17 |
Projection |
RPRJ |
Projection Resistance |
Spot Defined |
N/A |
|
18 |
Unspecified Projection |
UPRJ |
Unspecified Projection |
Spot Defined |
N/A |
|
19 |
Clinching Point 1 |
CLI |
Clinching Point |
Spot Defined |
N/A |
|
20 |
Clinching Point 2 |
CLI2 |
Clinching Point 2 |
Spot Defined |
N/A |
|
21 |
Rivet |
RVT |
Rivet |
Spot Defined |
N/A |
|
22 |
Unspecified BiW Mechanical
|
UNSM |
Unspecified BiW Mechanical
|
Spot Defined |
N/A |
|
23 |
Punch Rivet |
PR |
Punch Rivet |
Spot Defined |
N/A |
|
24 |
Blind Rivet |
BR |
Blind Rivet |
Spot Defined |
N/A |
|
25 |
Robot Sealant |
ROS |
Robot Sealant |
Spot Defined |
Curve Defined |
|
26 |
Manual Sealant |
MAS |
Manual Sealant |
Spot Defined |
Curve Defined |
|
27 |
Unspecified Sealant |
UNSS |
Unspecified Sealant |
Spot Defined |
Curve Defined |
|
28 |
Structural Adhesive |
STR |
Structural Adhesive |
Spot Defined |
Curve Defined |
|
29 |
Nonstructural Adhesive |
NSTR |
Non
Structural
Adhesive |
Spot Defined |
Curve Defined |
|
30 |
Unspecified Adhesive |
UNSA |
Unspecified Adhesive |
Spot Defined |
Curve Defined |
Either of Name, Acro or
Catia PTYP Name of the process type may be used for defining process types. The
spot and curve operation columns indicate the possibility of definition of the
process on curves or spots. For definition of process on curves, it is
necessary to define at least two sets of coordinates in the position columns.
6.1.3.8.
Diameter
A “diameter” column can
be added for defining a diameter for spot operations of thickness for curve
operations. A “default value” can be defined in the subtitle of this column. If
the table is missing the diameter column all the processes take a diameter
value of “3”.
6.1.3.9.
Flags
The “Flags” table title
may accommodate any number of sub columns for definition of flags for the
process. The “Is Geometry” and “Is Inspection” values are considered as
preserved words for flags which are specially treated in the program as
standard indications. Beside these two, any text or note can be given as flag
for the process.
6.1.3.10.
Tool Definition
Several optional titles may be added to the table for definition of tools. These titles include “Tool ID”, “Tool Generic Name”, “Tool Generic Type”, “Tool Manufacturer”, “Tool Manufacturer Type Code”, “Tool Program”, “Tool Location Code”.
Tool id
Tool ID is mandatory for definition
of tool for a process.
Tool Generic Name
Definition of the tool
generic name is optional and a default value can be defined for it in the
subtitle row. For a specific tool (i.e., a specific tool ID), it is enough to
define the tool generic name only once in the table.
Tool Generic Type
Definition of the tool
generic type is optional and a default value can be defined for it in the
subtitle row. For a specific tool (i.e., a specific tool ID), it is enough to
define the tool generic type only once in the table.
Tool Manufacturer
Definition of the tool manufacturer
is optional and a default value can be defined for it in the subtitle row.
For a specific tool (i.e., a specific tool ID), it is enough to define the tool
manufacturer of each tool only once in the table.
Tool Location Code
Definition of the tool location code
is optional and a default value can be defined for it in the subtitle row.
For a specific tool (i.e., a specific tool ID), it is enough to define the tool
location code of each tool only once in the table.
6.1.3.11. Tool Program
Tool program is a property attributed to the process definition. A specific tool may be used with different programs for several processes. The tool program may be a number a text of combination of numbers and text. Default value may not be defined for tool program in the table.
6.2. Apply to CAD Files
This menu provides two methods for applying the process definitions into CAD files. The first method is to add the processes as BiW Fastenings to the CAD files. This method creates BiW Fastening entities as provided in BiW Fastenings workbench of Catia. For more information about BiW Fastenings in Catia you may refer to the official help documents of Catia.
The second method for applying processes to the CAD files, creates spherical or worm shapes in Catia corresponding to spot or curve processes respectively.
6.2.1. Create BiW Fastenings
This menu item applies BiW fastening entities in Catia files corresponding to all stations with process definition in the project. Alternatively, it is possible to apply BiW fastenings to a specific station by right clicking on the corresponding node in the data tree view of the project and choosing “Apply Process to CAD Files -> Apply Automotive BiW Fastenings”, item in the opened pop-up menu.
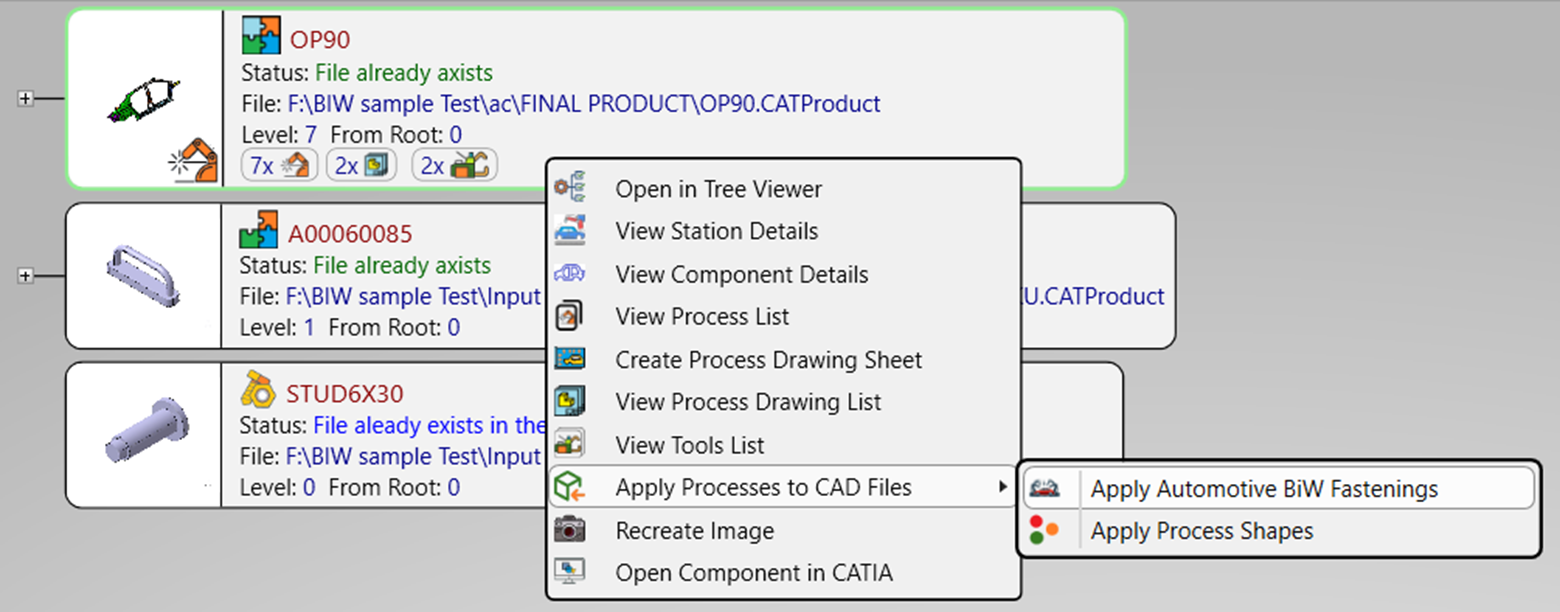
Figure
6
‑
8
Apply Proceess to CAD Files Through
Context Menu
6.2.1.1. Create BiW Fastening Options
Options for creation of BiW Fastenings are available in the “Process to CAD Options” tab of the options window. Shown in Figure 6‑9 . (Accessible through menu path “Options -> Settings”)

Figure 6 ‑ 9 Apply to CAD Files Options
The options include:
Only create export files
If this option is not checked, the program creates the BiW Fastenings in the Catia files, however, if this option is checked the program creates process export text file of the process definitions for each station. These export files can be imported into Catia files of the CATProduct file of station component by user.
More information about options of this page is available in section 8.1.5 .
6.2.2. Apply Balls and Shapes
This menu item creates a ball shape for each spot processes and a worm shape along the curve path for each curved process. This menu item creates shapes in Catia files corresponding to all stations with process definition in the project. Alternatively, it is possible to apply process shapes to a specific station by right clicking on the corresponding node in the data tree view of the project and choosing “Apply Process to CAD -> Apply Process Shapes”, item in the opened pop-up menu ( Figure 6‑8 ).
There are two options of file type for creation of the shapes which are selectable in the options window ( Figure 6‑10 ). In the default and first method (i.e., “In Single Catia Part”), all the process shapes of a station are created in a CATPart file and each process shape is created as a body in the created CATPart file with the same name as the process ID. In the second method (i.e., “As Catia Product”), each process shape is created in an individual CADPart file and a CATProduct is also created to accommodate the process shape CATParts.
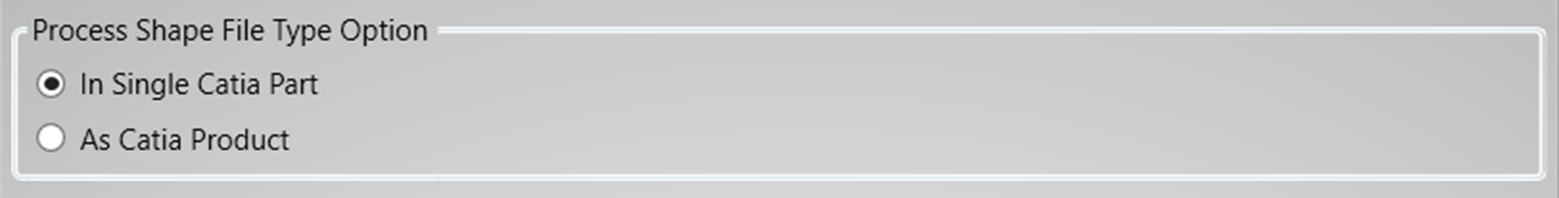
Figure 6 ‑ 10 Proess Shape File Type Options
Two options are also selectable for “Insertion of Shapes”, shown in Figure 6‑11 . If The option of “Only Create the Shape Catia File” is selected the Catia file for the shapes are created but are not inserted to the station product CAD files, whereas the option “Insert into the Station Product” inserts the process shape files into the station product CAD file.
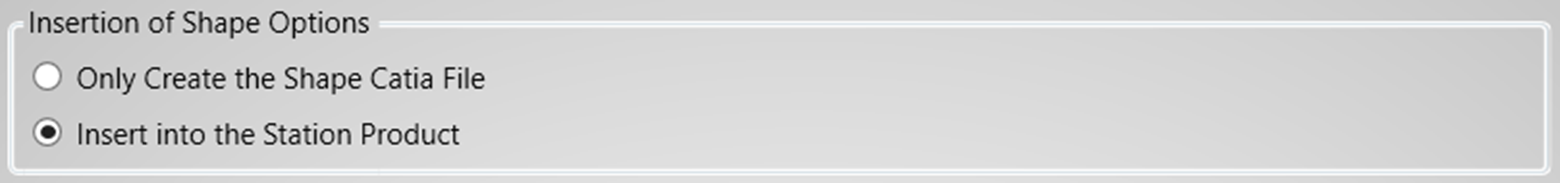
Figure 6 ‑ 11 Insertion of Shape Options
More information about options of this page is available in section 8.1.5 .
6.3. Generate Drawing Sheet(s)
This menu item opens a dialogue box for creation of process sheets of the stations. Alternatively, the process sheet creation dialogue box is also available through right clicking on a station in the tree nodes in the data tree viewer for a specific station.
6.3.1.
Process Sheet Creation
Dialogue Box
Process sheet creation
dialog is in two slightly different form depending on if it is opened for
creation of drawings for a single station (i.e., when called through the
context menu by right click on a station node in tree view or by click on the
icon in the toolbar), or if it is opened for batch creation of drawings on
multiple stations (i.e., when called through main menu). The two different
forms of the PSC dialog box are shown in
Figure 6‑12
and
Figure 6‑13
.
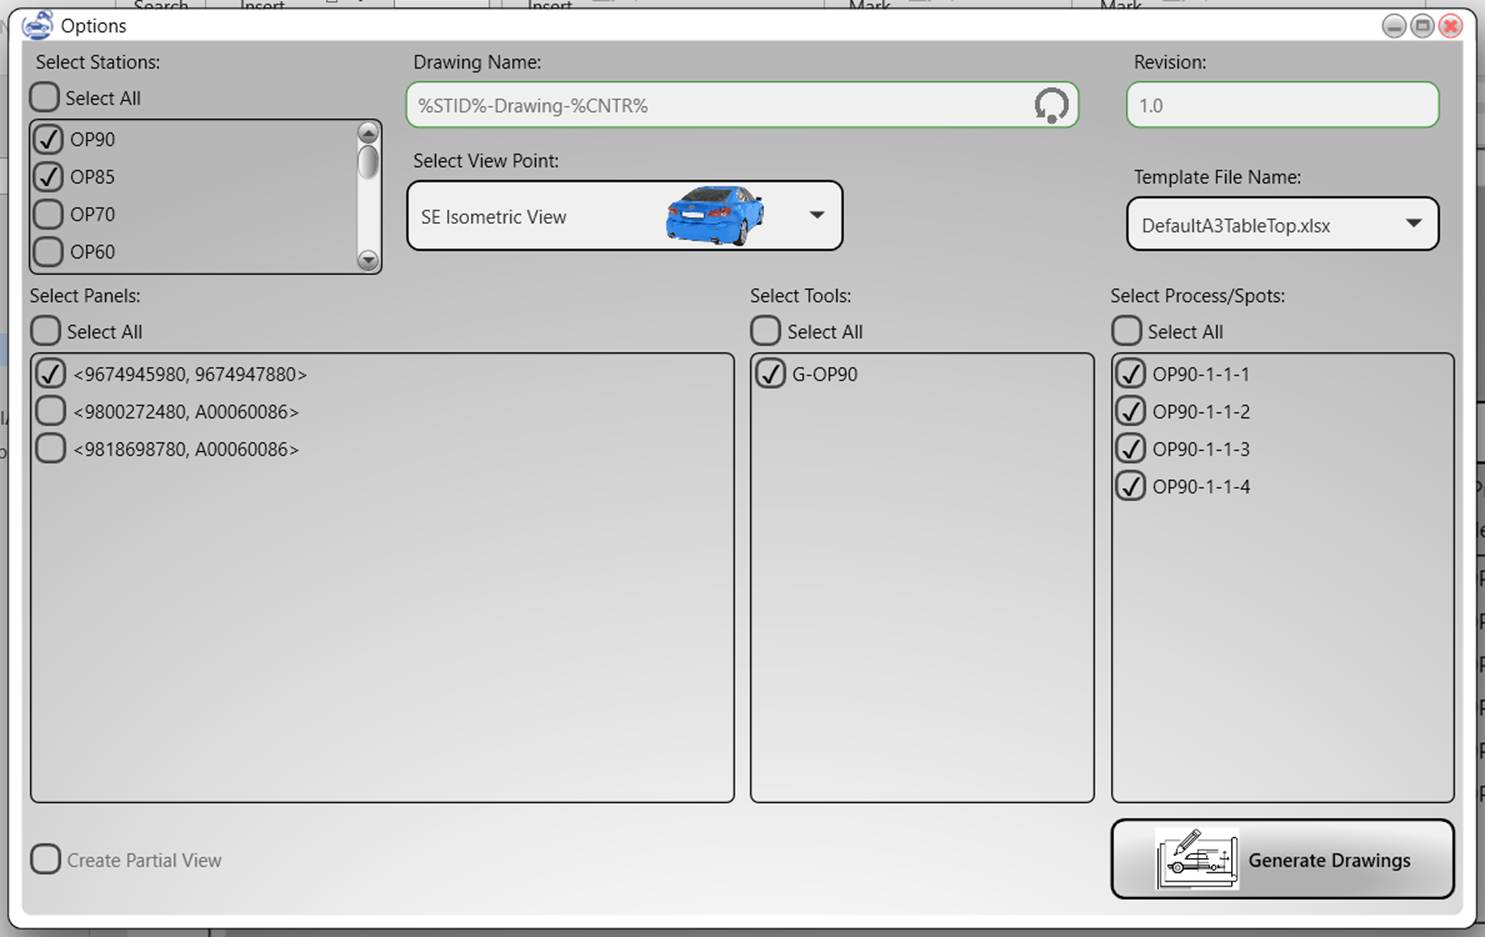
Figure 6 ‑ 12 Process Sheet Creation Dialogue Box for Multiple Station
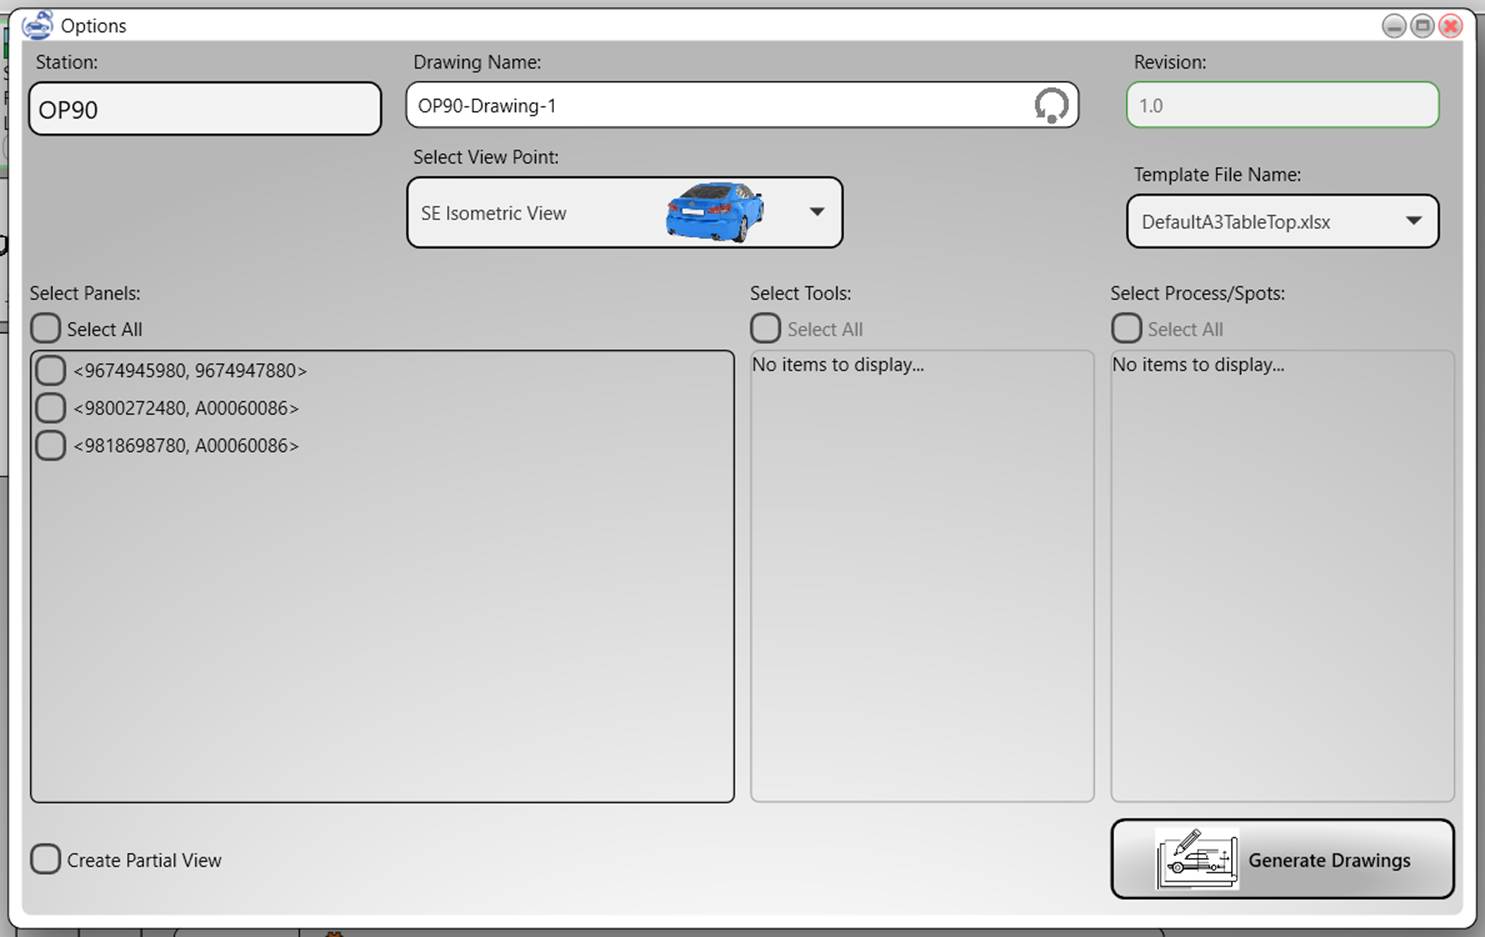
Figure
6
‑
13
Process Sheet Creation Dialog Box
for Single Station
The differences in the
dialog boxes include the station selection pane which is not available in the
single station dialog box.
6.3.1.1.
Drawing Name
The drawing name can be
entered or edited in the drawing name text box. If a drawing is being created
for the first time a default drawing name is assigned automatically by the
program for the drawing. However, the user can modify or change this default
auto generated drawing name. The drawing name should be unique and if an
already existing drawing name is entered, a warning message appears above it
and the program will not create the drawing until a valid drawing name is
entered. The changes in the drawing name can be reset by clicking on the icon
button,
![]() ,
on the right side of the drawing name text box.
,
on the right side of the drawing name text box.
The default
auto-generated drawing name is generated according to the drawing name template
that can be managed in the options window (see section
8.1.3.1
).
If a drawing is
regenerated for a new revision, the drawing name is set equal to its name and
is not editable by user.
6.3.1.2.
Revision
Revision of the drawing
is shown in the revision text box. The Revision is set to 1 the first time a
drawing is created. Each time a drawing is regenerated the revision of the
regenerated drawing is incremented by one.
6.3.1.3.
Selection of stations
On the top left corner of the process sheet creation dialogue box (PSC Dialogue) there is a check box list of station with process definitions. The station or stations for which it is intended to create the process sheet can be selected from this list. A select all check box is also available above the list that simplifies selection of all stations for batch creation of process drawing sheets. In case the PSC dialogue box is called through pop up menu in the project tree view, the station ID of the intended station appears in place of the station selection list.
6.3.1.4. Selection by Panel (Pairs)
After selection of stations, a check box list of panels or panel pairs for which there are process definitions in the selected stations appears on the left side of the PSC dialogue box. This list allows filter out the process definitions with respect to their affected panels. A select all check box is available above the list in case filtering out the process definitions by panels is not intended.
6.3.1.5. Selection By Tool
A list of tools assigned to the selected processes is given in the PSC dialogue window. This list allows to filter out process definitions with respect to their assigned tools. By checking the select all check box above this list the filtration by tool is bypassed.
6.3.1.6. Selection by Process ID
The list of process IDs after passing the filters of station, panel and tool sections is given in this area of the PSC dialogue box. The desired process IDs can be selected by checking the corresponding check box. The select all check box above the lost allows to select all the listed processes.
6.3.1.7.
Sheet Template Selection
The sheet template
selection combo provides a list of available sheet templates for selection. A
blank sheet and several default sheet templates are available as out of the box
companions of the program. The default sheet templates are available for A4, A3
and A2 drawing paper sizes. The tables of the default sheet templates provide
place holders for “logo Image”, “project name”, “Station ID”, “drawn by” and
“drawing date” information of the drawings that can be filled by automatically
by program. Adding, removing and modification of the sheet templates is possible
through “sheet templates” tab in options window. (Explained in
Error! Reference source not found.
8.1.3
).
6.3.1.8. ViewPoint Selection
The view point selection combo appears on top right side of the PSC Dialogue box. This combo provides a list of frequently used viewpoints in engineering drafting. A small car image from the corresponding view point is shown for each listed view point. A custom view point option is also given at the end of the list, by choosing of which, the user can create the drawing in any desired view as explained in section 6.3.1.9 .
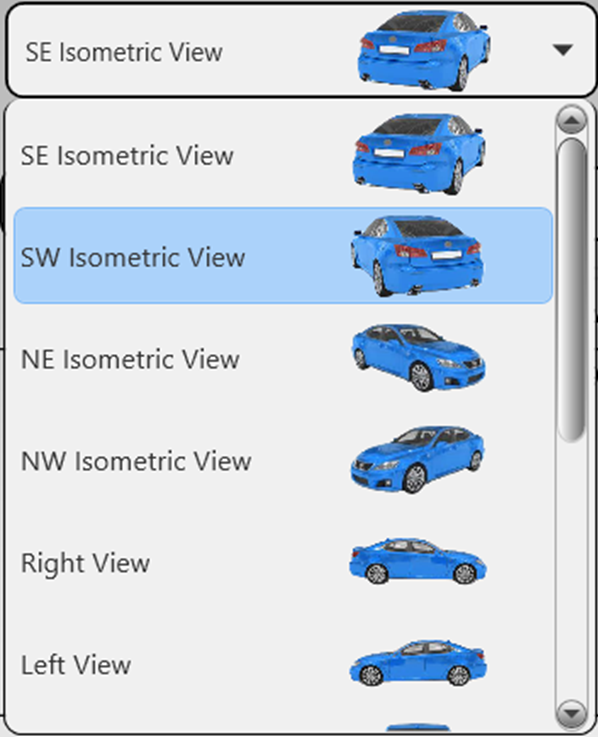
Figure 6 ‑ 14 View Point Selection Combo
6.3.1.9. Custom Viewpoint
If the custom viewpoint (
![]() )
is selected in the viewpoint selection combo, the program will ask the user for
adjustment of the viewpoint and drawing extents during creation of the drawing.
After, clicking on the “Create drawing” in the PSC dialogue box it might take a
short while for the program to load the component in Catia. The program brings
Catia to the view of the user with a message box stating “Please adjust the
view angle the desired and click OK”. At this moment the user can adjust the
view angle of the model in the desired angle by means of available options in
Catia like
)
is selected in the viewpoint selection combo, the program will ask the user for
adjustment of the viewpoint and drawing extents during creation of the drawing.
After, clicking on the “Create drawing” in the PSC dialogue box it might take a
short while for the program to load the component in Catia. The program brings
Catia to the view of the user with a message box stating “Please adjust the
view angle the desired and click OK”. At this moment the user can adjust the
view angle of the model in the desired angle by means of available options in
Catia like
![]() ,
,
![]() ,
,
![]() ,
mouse gestures, etc. After adjusting the desired angle, the user should click
on “OK” button in the message box. It then takes a while for the program to
generate the drawing.
,
mouse gestures, etc. After adjusting the desired angle, the user should click
on “OK” button in the message box. It then takes a while for the program to
generate the drawing.
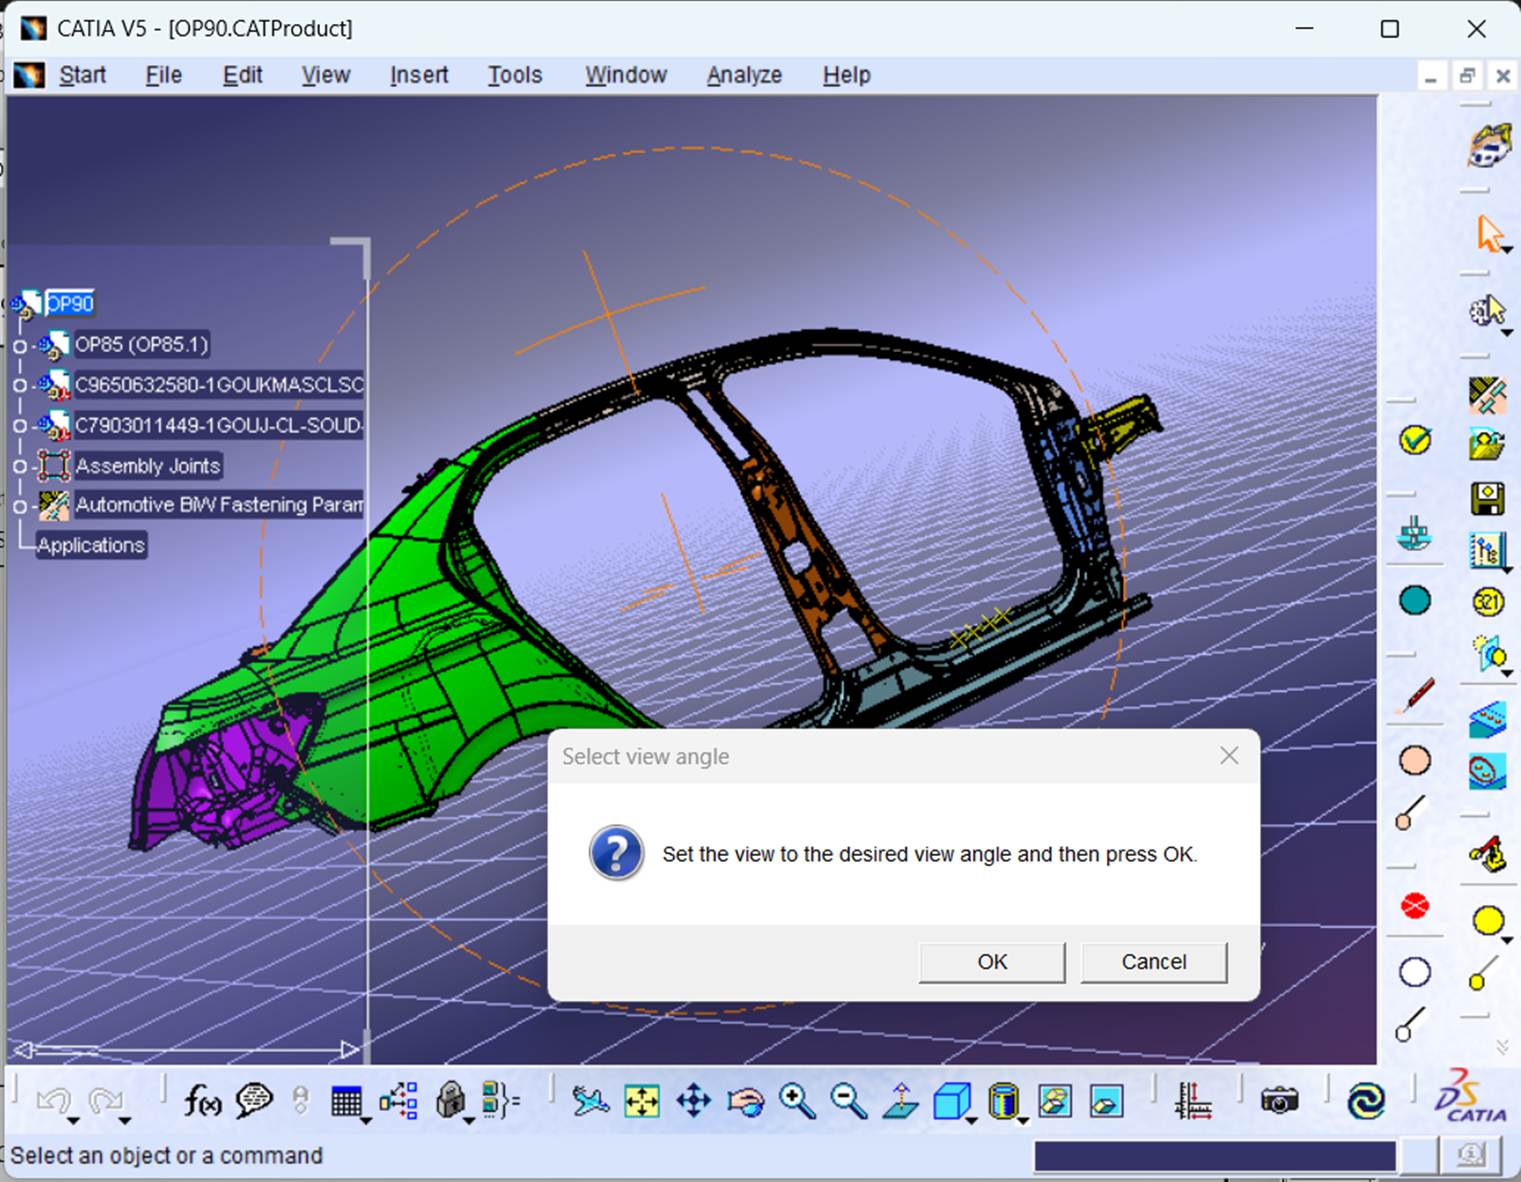
Figure
6
‑
15
Drawing adjustment dialogue
window
6.3.1.10. Create Drawing Button
By clicking on this button, the program starts to create the drawing or drawings for the selected process IDs with respect to the selected viewpoint and sheet template. There are more options available in “PS Sheet” tab in options window (See 8.1.4 ) for creation of the drawings. During creation of the drawings the Catia and Excel applications are hidden by the program, however, it is possible to unhide them through corresponding menu items in “Options” menu (See 8.2 and 8.3 ). After creation of the drawings, Catia and Excel application will be visible again. If several drawings are created in a batch drawings creation a window, listing created drawings, will be opened and in case of creation of a single drawing a drawing detail window will be opened.
If partial view check box is checked in the PSC dialog box, the program will ask the user for adjustment of the and drawing extents during creation of the drawing. As explained in section 6.3.2 .
6.3.2. Partial View Creation
If partial view check box is checked in the PSC dialog box, the program will ask the user for adjustment of the drawing extents during creation of the drawing. A partial view drawing focuses on the selected part of the component and only the focused part is depicted in the drawing. A small whole view of the drawing is created on a corner of the drawing in which a rectangle indicates the extents of the selected part of the view. An example of a partial view drawing is shown in Figure 6‑16 .
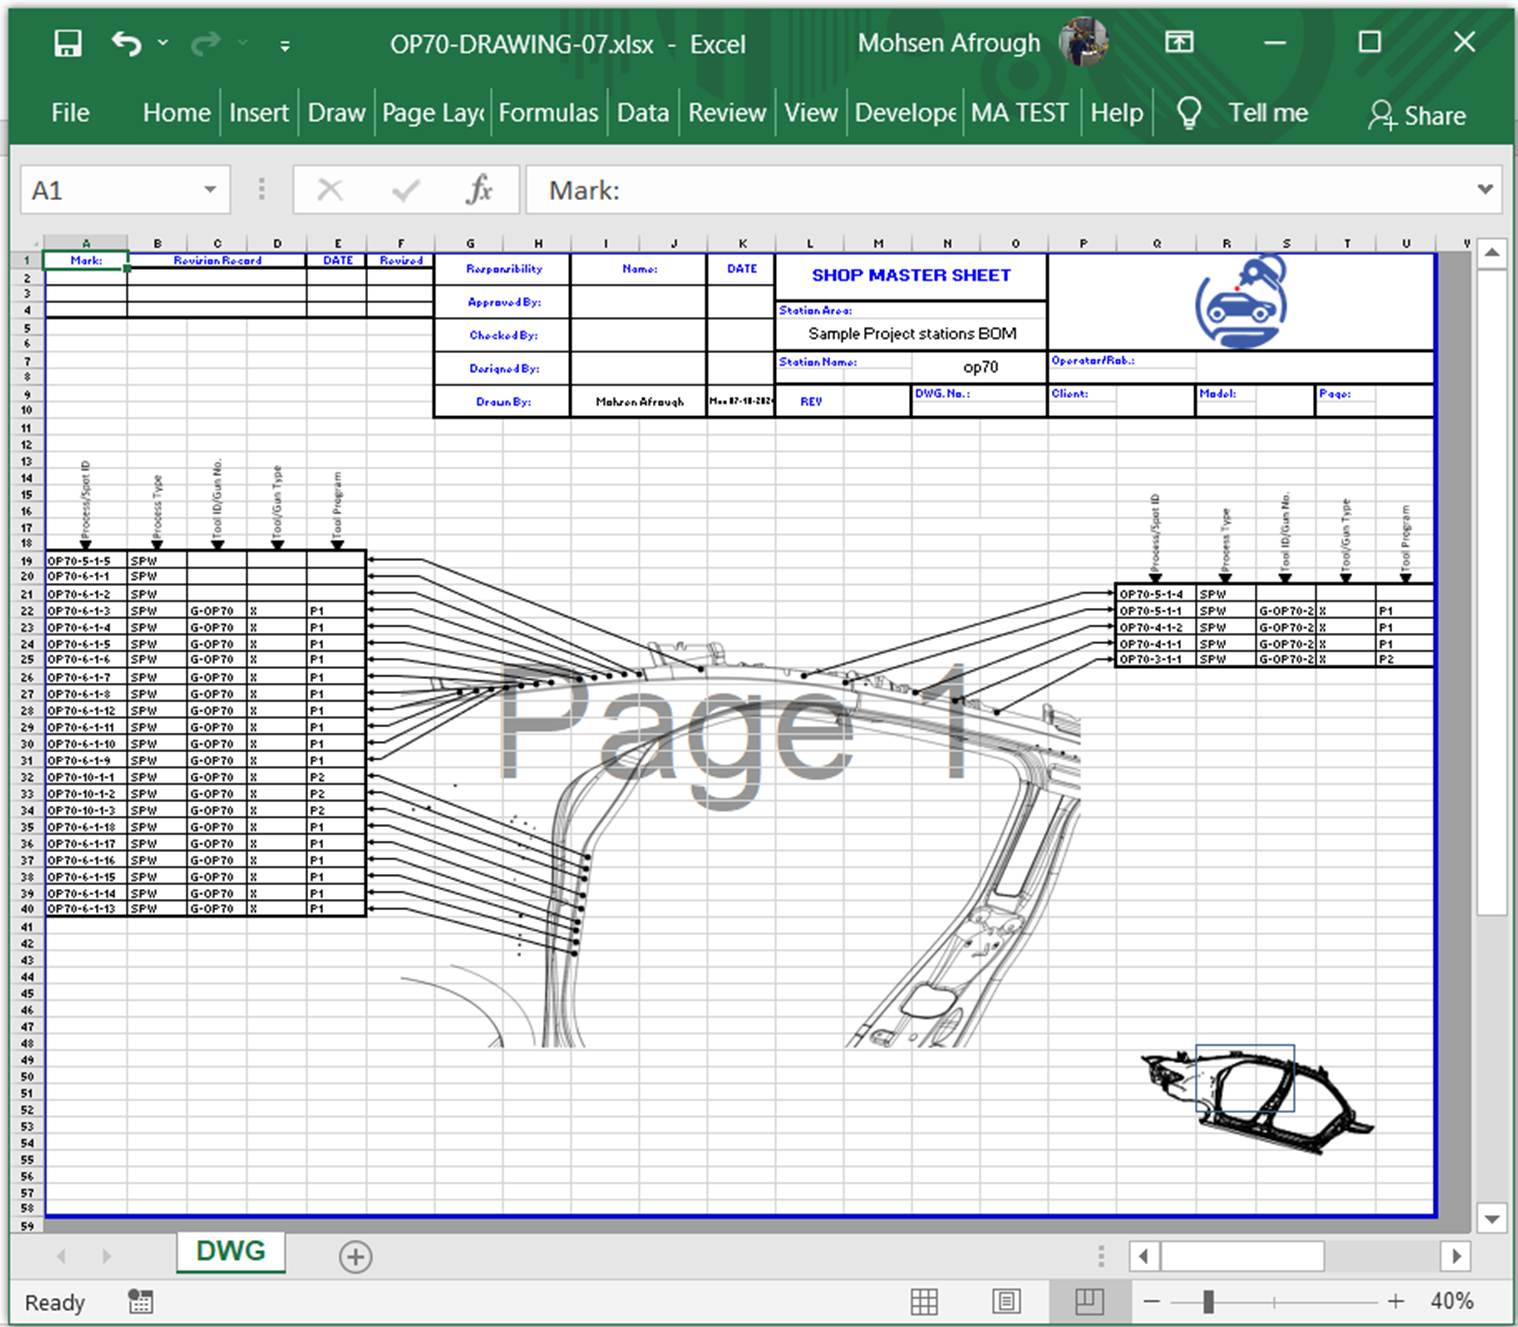
Figure 6 ‑ 16 An example of a Partial View Drawing
There are two different options for drawing extent adjustment with can be chosen through a pair of radio buttons in the options window (See 8.1.4.3 ). These options include “In Catia” and “In Crop Window” which are explained here.
6.3.3.
Partial View Extent
Adjustment in CATIA
If “In Catia” choice is selected for creation of the partial views (In Program Options), after creation of the drawing scheme the drafting window of the Catia appears to the user with the drawing of the whole component model made in the selected view angle. A drawing adjustment dialog window appears on top of the Catia window which provides tools for magnify, minify, move and rotate or fit in page of the drawing etc. as shown in Figure 6‑17 .
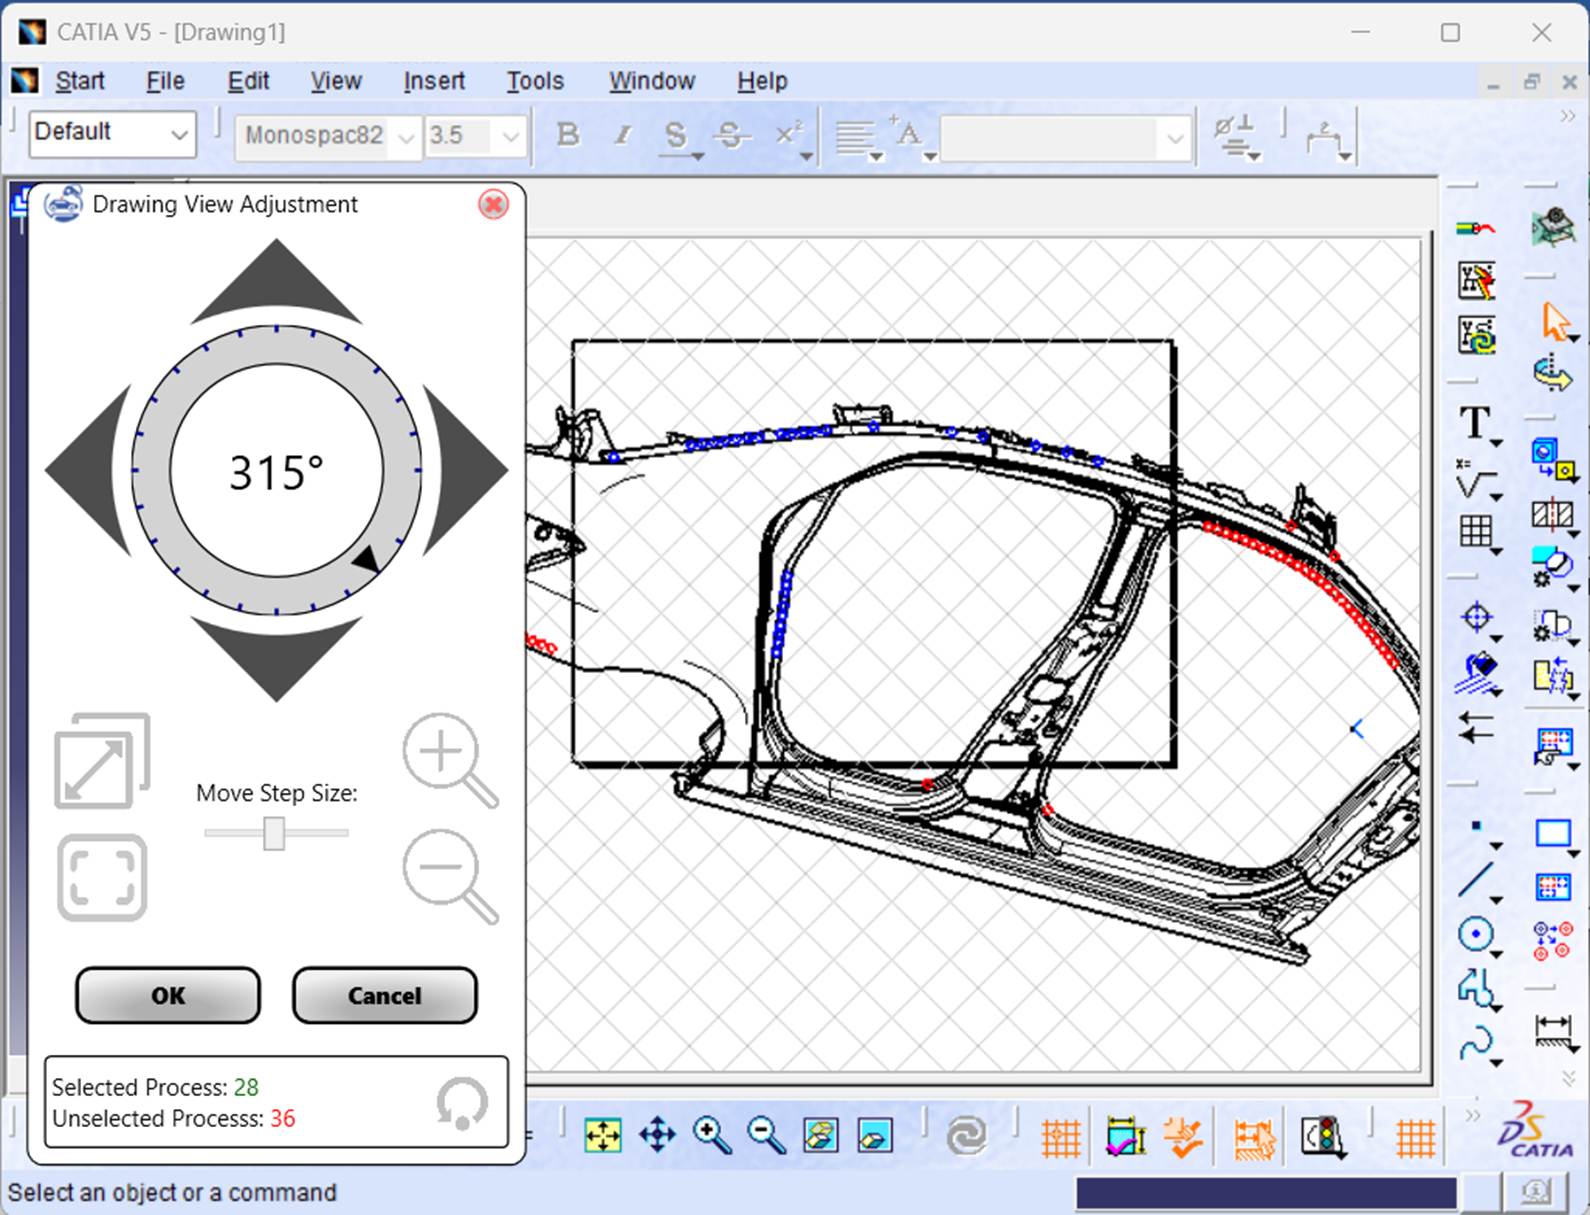
Figure
6
‑
17
Drawing Extent adjustment in Catia
The user can adjust the intended extent of the drawings so that the part of the drawing lies inside the boundaries of the drawing sheet (appearing as a black thick rectangle in the Catia drafting window). The adjustment can be done by means of the tools in the extent adjustment dialog window. The selected process definitions for the drawing appear in the drawing as tiny circles. If the process lies inside the boundaries the process is colored blue and in case the process lies out of the boundaries the color turns red. This way the user can consider the inclusion of desired processes in the drawing.
6.3.4.
Partial View Extent
Adjustment in Crop Window
As an alternative way of
adjustment of the extents of the drawing, the program provides a crop window in
which the user can select the desired boundaries of the drawing. After creating
the drawing scheme, the program opens a crop window in which the whole view of
the drawing is shown to the user. The selected processes appear as green solid dots
on the drawing. If moues pointer is kept on each of the process dots, a brief
report of the process information appears on the screen.
The drawing extents can
be selected by clicking on a corner of the perceived view rectangle and
dragging it up to the opposite corner. The selected area will be shown as a
bright rectangle and the outer areas turn darker. Also, the color of processes,
out the selected boundary, turn pale. As shown in
Figure 6‑18
.
Figure
6
‑
18
Extent Adjustment in Crop Window
As shown the statistics
of selected and unselected processes is shown on side bar of the crop window,
as well as a slider for adjustment of size of the process dot marks. A crop
reset Button (
![]() )
allows the user to reset the selected extent button. By clicking on ok the
selected extent is confirmed and the drawing is created accordingly.
)
allows the user to reset the selected extent button. By clicking on ok the
selected extent is confirmed and the drawing is created accordingly.
6.4. Process Sheet Settings
This menu item opens the
process sheet setting options tab in the options window.
(see
8.1.4
)
6.5. Manage Sheet Templates
This menu item opens the
drawing sheet templates tab in the options window.
(see
8.1.3
)
6.6. Manage Standards
The default standard of
Catia BiW Fastenings module is predefined in the
program under name of “GBF_STD” with the default process types as those of
default “GBF_STD” standard of Catia. If the BiW
Fastenings standard in Catia is customized or new standards are defined in
Catia, the equivalent standard can be defined or edited in the BiW-AP to correspond it. More information about Catia BiW Fastening standards can be found in the help documents
of Catia. Definition of custom BiW fastenings in
Catia is not a common practice. So, if your Catia BiW
Fastening is not customized you can skip this reading section.
If your Catia BiW Fastening is customized, it is recommended to follow
the instructions of this section with consultation of the expert persons in
charge of customization of BiW fastenings module of
your Catia. Because this section uses the same parameter names and settings as
those used in BiW fastenings module of Catia.
A click on manage
standards menu item opens the standards management window as shown in
Figure 6‑19
.
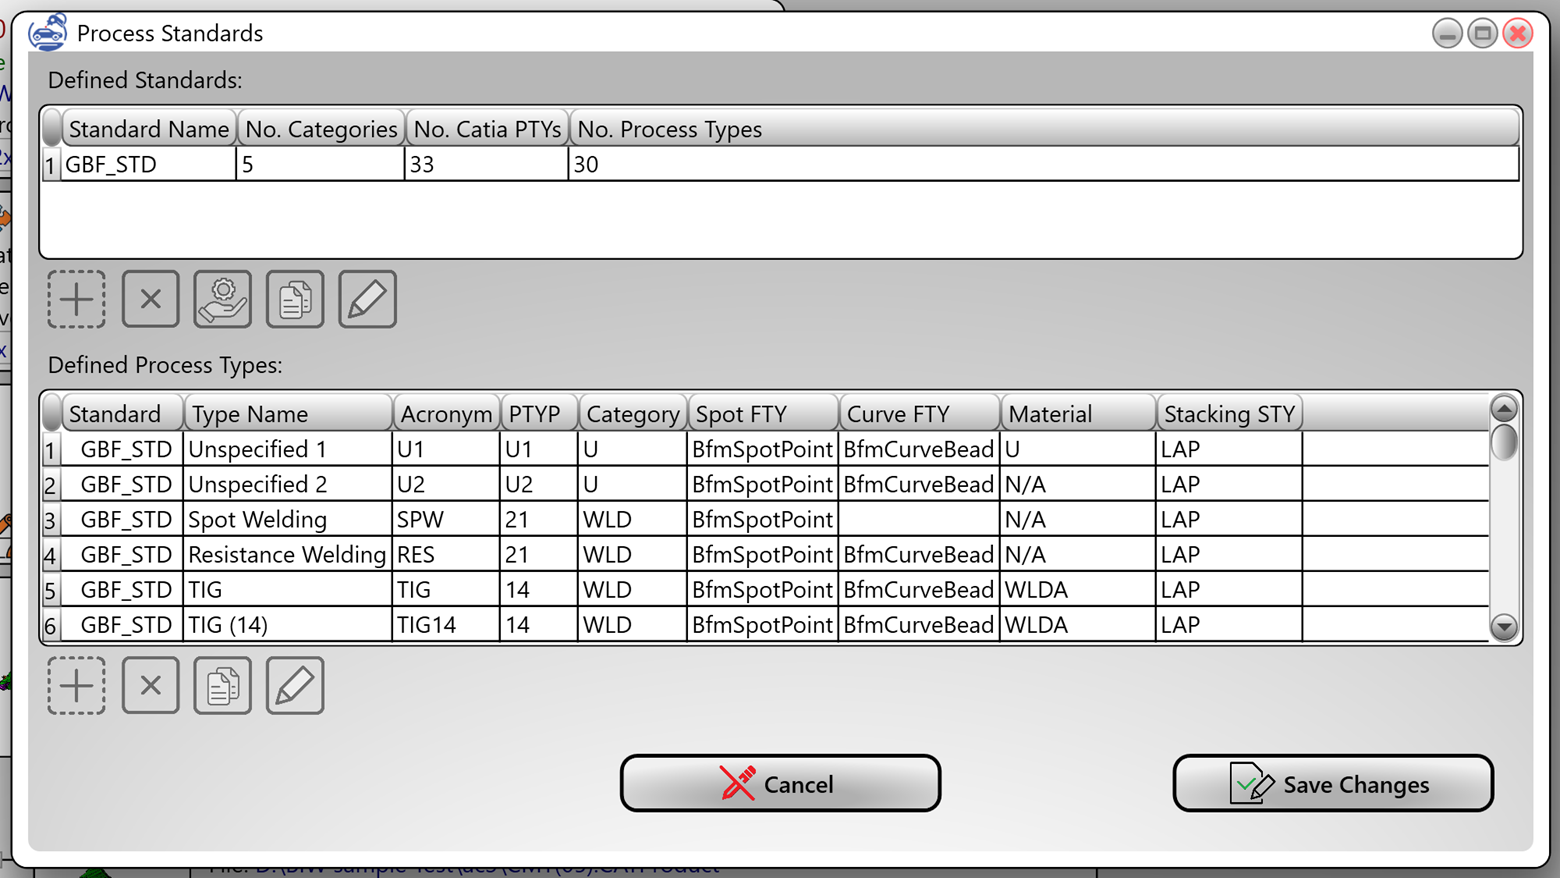
Figure 6 ‑ 19 Manage Process Standards Window
6.6.1. Defined Standards
A list of defined
standards is shown under defined standards label in the standards management
window.
Icon buttons under this
list i.e.
![]() ,
,
![]() ,
,
![]() ,
,
![]() ,
,
![]() respectively allow adding new standard, deleting
a standard from the list, loading default standard definition, making a
duplicate copy of the selected standard and editing the selected standard.
respectively allow adding new standard, deleting
a standard from the list, loading default standard definition, making a
duplicate copy of the selected standard and editing the selected standard.
6.6.2. Defined Process Types
Accumulative list of
defined process types according to all defined process standards, is shown on
bottom of the window. Icon buttons under this list i.e.
![]() ,
,
![]() ,
,
![]() ,
,
![]() respectively allow adding new process types,
deleting a standard from the list, making a duplicate copy of the selected
process type and editing the selected process type.
respectively allow adding new process types,
deleting a standard from the list, making a duplicate copy of the selected
process type and editing the selected process type.
6.6.3. Define and Edit a Standard
A new Standard can be created
by clicking on each of new default or copy standard buttons (i.e.
![]() ,
,
![]() or
or
![]() ) under the defined standards lint in the manage
process standards window. After creation of the new standard, it can be edited
by clicking on the edit button (i.e.
) under the defined standards lint in the manage
process standards window. After creation of the new standard, it can be edited
by clicking on the edit button (i.e.
![]() ). The standard edit
window opens as shown in
Figure 6‑20
. This window allows to define the standard
process type and parameter definitions corresponding to those of customized
standard in Catia.
). The standard edit
window opens as shown in
Figure 6‑20
. This window allows to define the standard
process type and parameter definitions corresponding to those of customized
standard in Catia.
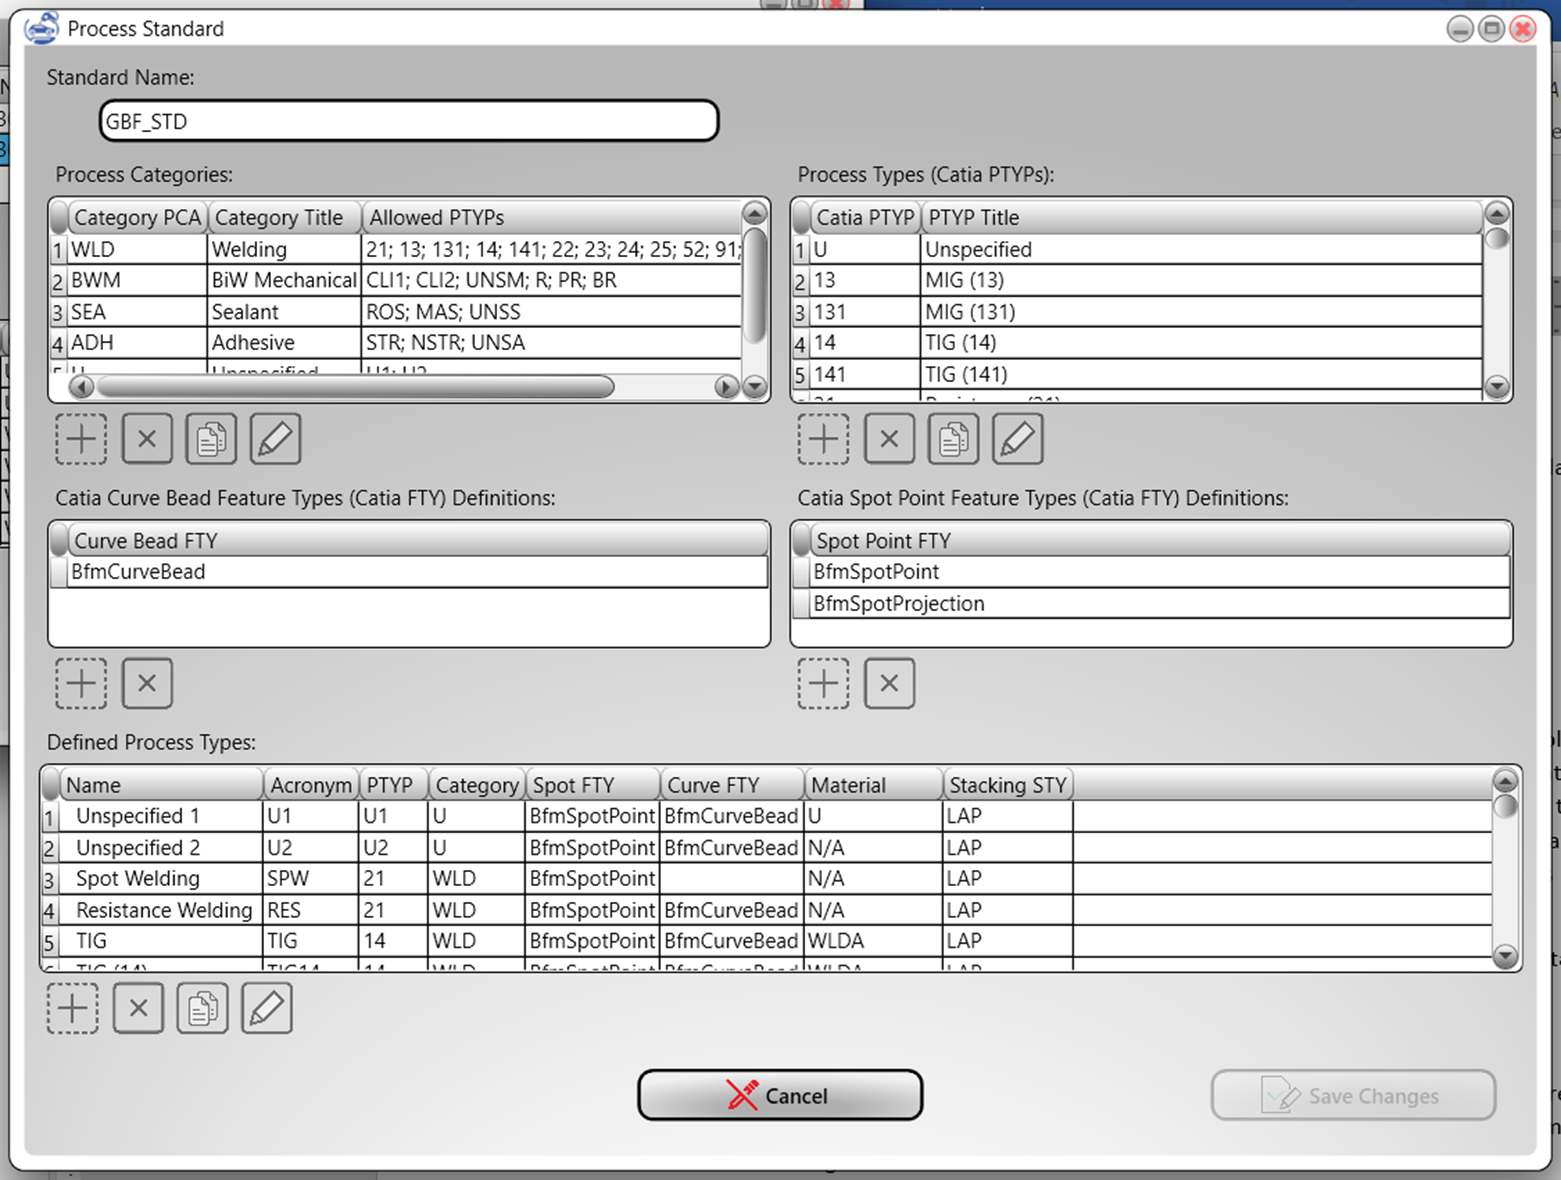
Figure
6
‑
20
Edit Standard Window
6.6.3.1.
Standard Name
The standard name can be
directly edited in the standard name text box on top of the window. It should
be the same as the standard name in your Catia in case you wish to
import/export process definitions between BiW-AP and
Catia. The default standard name in Catia is GBF_STD and it is already
available in BiW-AP as the default standard
definition.
6.6.3.2.
Catia PCA
The process categories,
named PCA in Catia standard definition (Ref. Catia help documents), are defined
in this list. The PCA definitions can be added, deleted, copied or edited by
clicking on the icon buttons under the list. By Clicking on either of the add
or edit buttons, a PCA edit window opens for editing the new or selected PCA as
shown in
Figure 6‑21
.
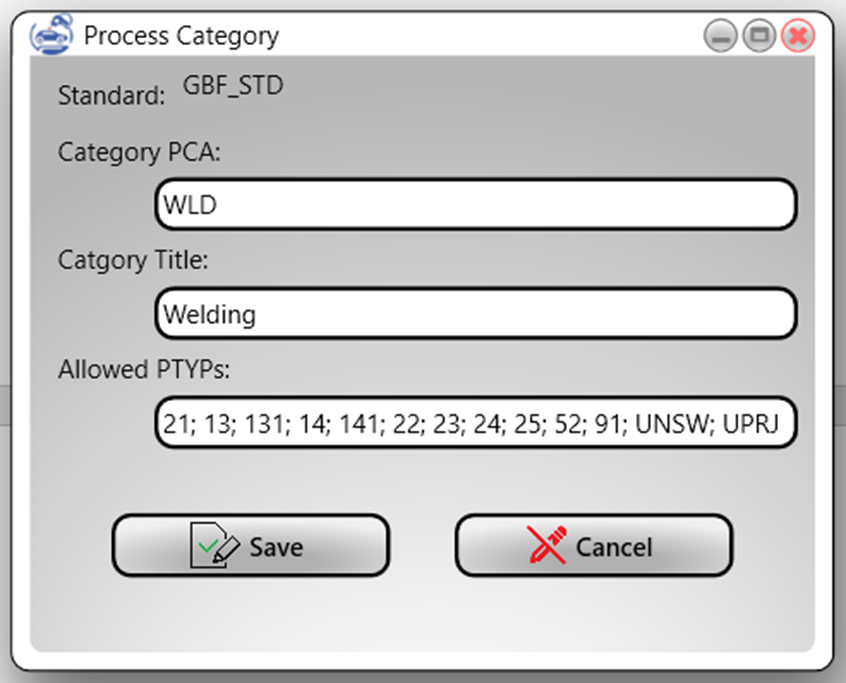
Figure
6
‑
21
PCA Edit Window
6.6.3.3.
Catia PTYP
The process types, named
PTYP in Catia standard definition (Ref. Catia help documents), are defined in
this list. The PTYP definitions can be added, deleted, copied or edited by
clicking on the icon buttons under the list. By Clicking on either of the add
or edit buttons, a PTYP edit window opens for editing the new or selected PTYP
as shown in
Figure 6‑22
.
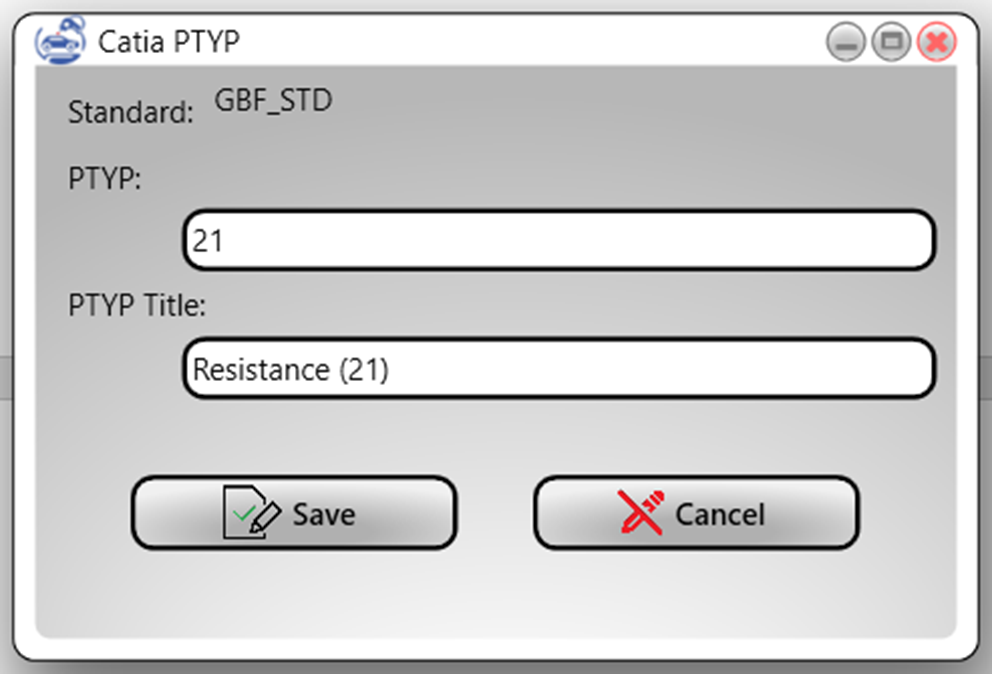
Figure
6
‑
22
PTYP Edit Window
6.6.3.4.
Catia FTY
The feature types, named FTY
in Catia standard definition (Ref. Catia help documents), are defined in two
separate lists for definition of curve bead feature types and spot point
feature types. The FTY definitions can be added or deleted by clicking on the
icon buttons under the list. By Clicking on the add button, a FTY definition
window opens for defining the new FTY as a single string as shown in
Figure 6‑23
.
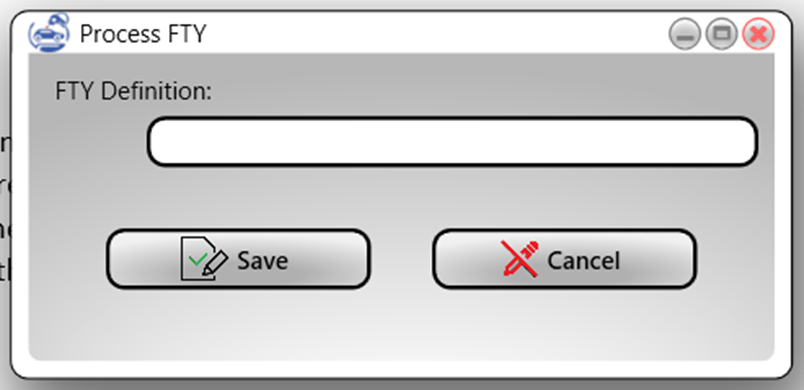
Figure 6 ‑ 23 FTY Definition Window
6.6.3.5.
Process Types
The defined process types
under the standard definition are listed on bottom of the standard edition
window. The process type definitions can be added, deleted, copied or edited by
clicking on the icon buttons under the list. By Clicking on either of the add
or edit buttons, a process type edit window opens for
editing the new or selected process type as shown in
Figure 6‑24
.
The value of parameters
in the process type edit window should be in accordance to the standard
definition. The value of the stacking type is set to LAP which is the only
available stacking type in the default standard definition in Catia. If your
customized standard defines a new stacking type it can be entered in this
field. The values of “Name” and “Acronym” are used only by BiW-AP
and can be chosen freely.
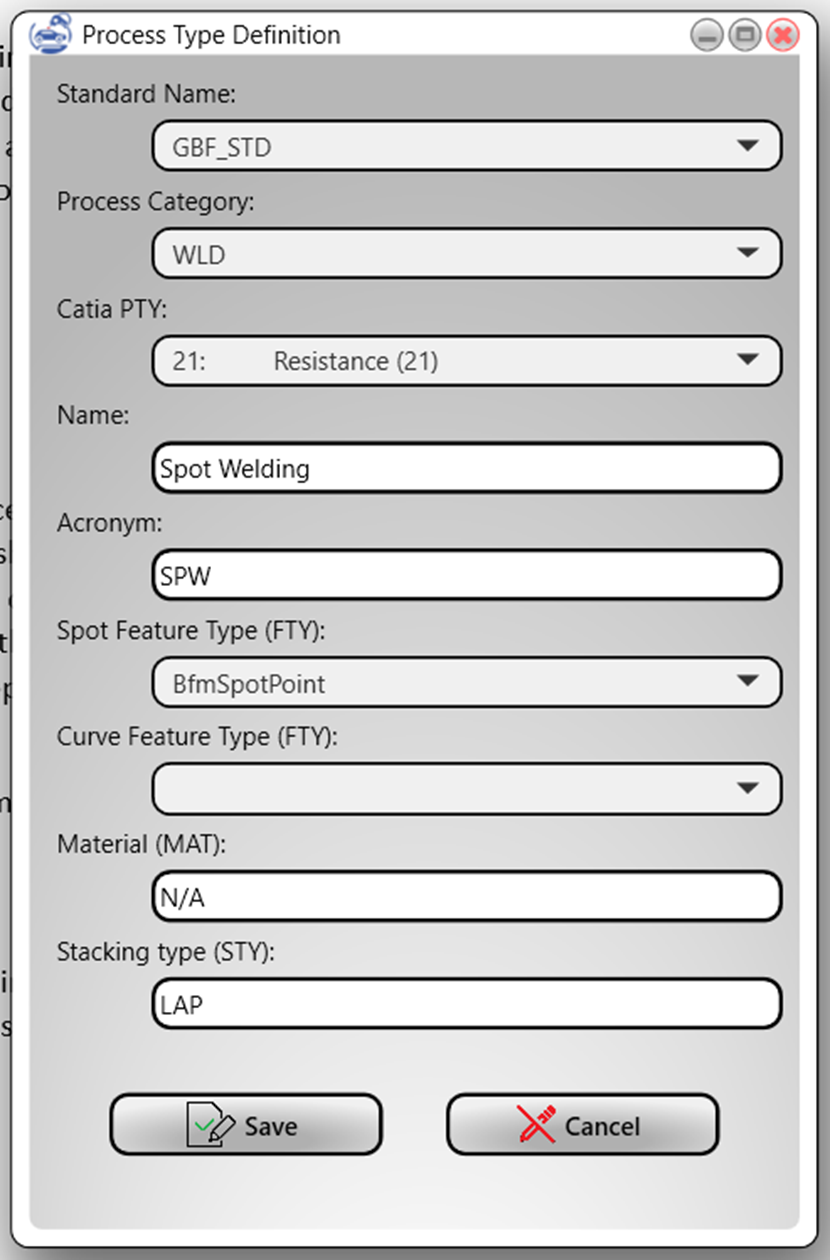
Figure
6
‑
24
Process Type Edit Window
7.
Report Menu
This menu provides
facilities for observing and accessing the project data in tables and making
table reports in Excel sheets. Validation of the drawing sheet is a special
feature in the table reports that continuously check the consistency of the
process drawings and the current process definitions in the project. Any
changes in the process definitions of the project like deleting a process or
moving to a different station is continuously checked by the report tables and
any invalidation of the drawings is instantaneously reflected in the report
tables.
The reports menu also
provides a tree chart of family tree which can be considered as a documentation
of the BiW Line assembly plan.
7.1. Create Tree Chart in Excel
The program starts
creation of a family tree chart in Excel right after clicking on this menu
item. Creation of chart takes a few moments and the job progress is indicated
in status bar of the program. A sample of created chart is shown in
Figure 7‑1
.
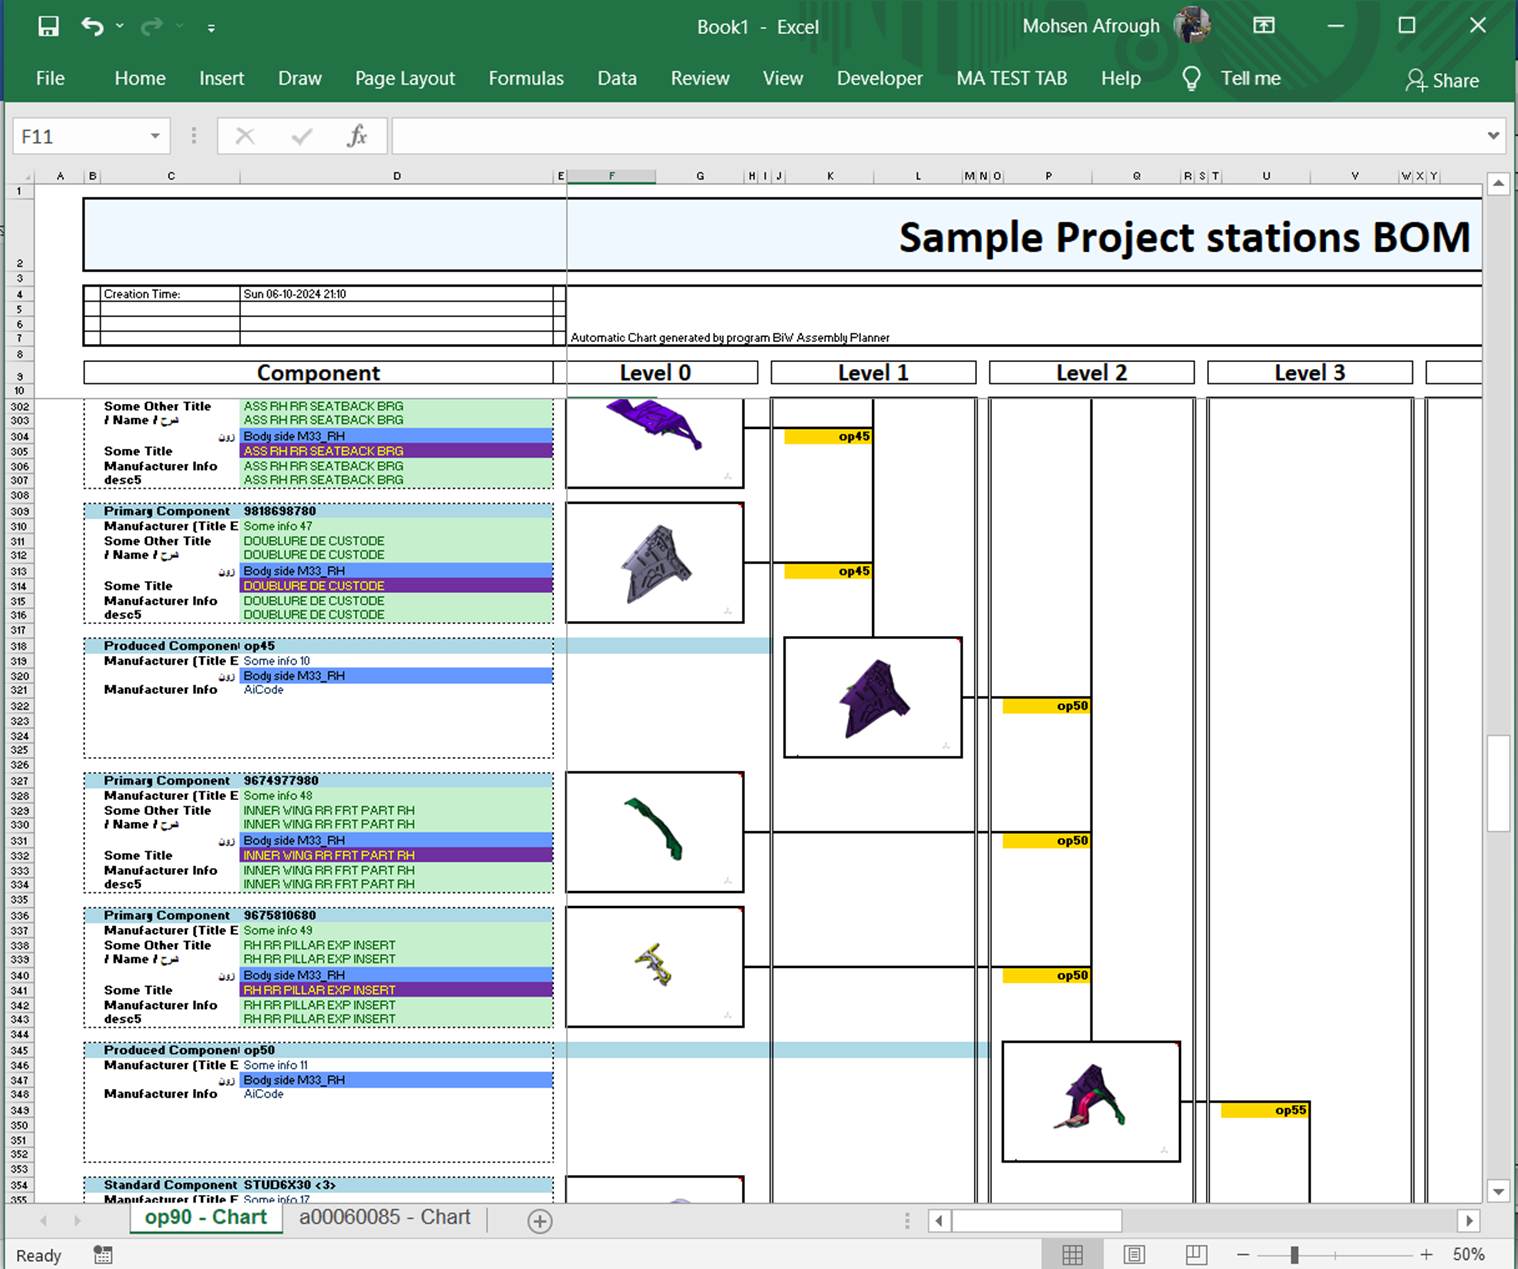
Figure
7
‑
1
An example of tree chart in excel
It includes a title area, info table, component information area, and level columns. The title area is filled with the project title by default but can be set to the desired title in the chart options window. The info table under the title area is mostly left bank and can be filled with any desired info by the user. The component info area provides information of the tree nodes including node type (i.e., primary component, standard part, sub assembly component, etc.) and properties of component. And, the level columns provide places for picture of each node component in its respective column level. The levels start from 0 for the primary components and instances of standard part or subassembly and continues up to the highest level which might be a factory product or a subassembly.
Several options are available for creation of a tree chart
in Excel that can be accessed through path Options > Settings > Tree
Chart tab (Ref. sec.
8.1.2
).
7.2. Family Tree Node List
This item opens a window listing
all nodes in the family tree structure of the project as shown in
Figure 7‑2
.
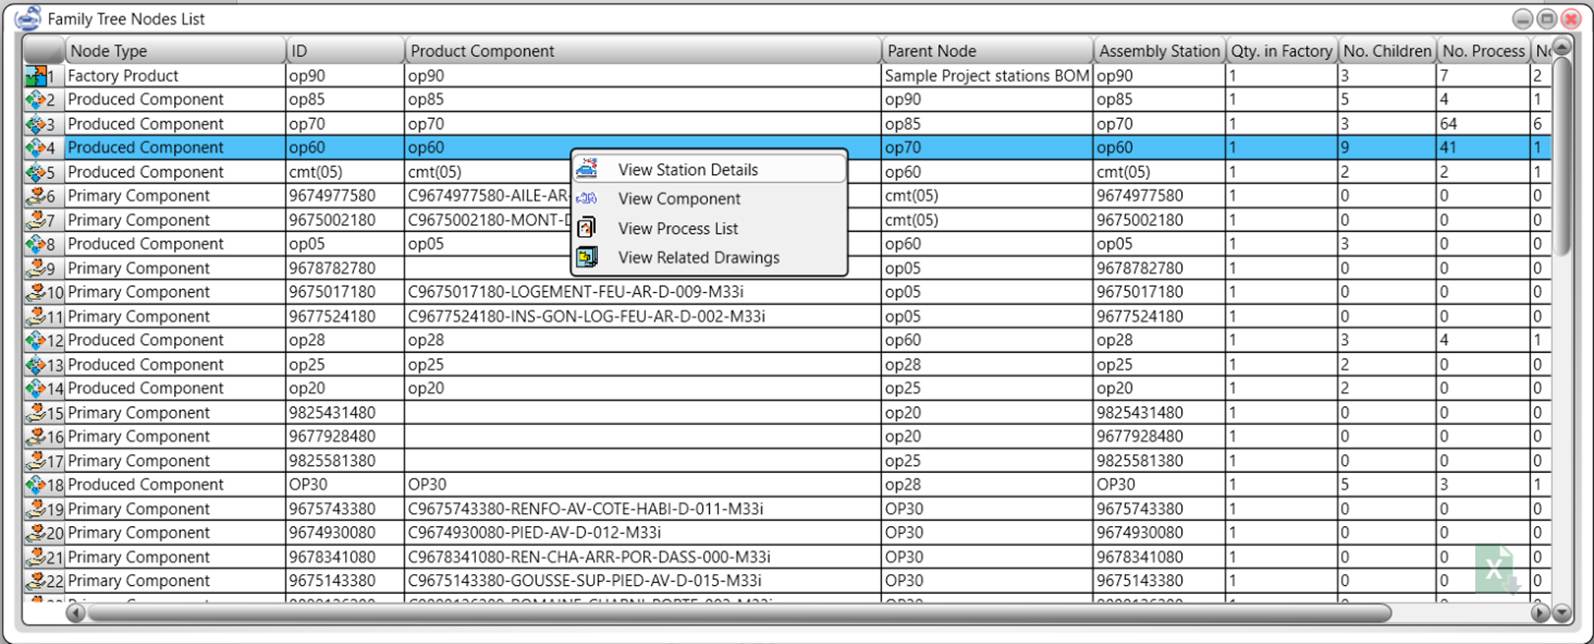
Figure 7 ‑ 2 Family tree node list report window
Listed Node Informaton
Information listed for
each node in the family tree node list viewer include the items listed in
table:
Table 7 ‑ 1 Family tree node listed information
|
Column
Title |
Description |
|
Node Type |
see
3.2.6
|
|
ID |
ID of the node |
|
Parent Node |
ID of the parent node. For
factory products, subassemblies and standard parts, the parent node reads the
project name (considered as the factory name) is shown. For other node types,
the ID of the direct parent node in the tree branch is listed. |
|
Assembly Station |
ID of the assembly station. For
subassembly and standard part instance nodes, it’s the ID of the subassembly
station or the standard part. Otherwise, it’s the same as the node ID |
|
Qty. in Factory |
Quantity of the component
product of the node used in the factory. For subassemblies and standard
parts, it’s the number of instances of the component inserted in the family
tree of the factory product.
For nodes of the subassembly
branches the quantity is multiplied by the quantity of the subassembly in the
factory. |
|
No. Children |
Number of children components of
the node |
|
No. Process |
Number of processes defined in
the node station |
|
No. Drawings |
Number of process sheet drawings
created for the node |
|
No. Tools |
Number of tools defined for
processes in the node |
In addition to the listed
information, a small icon of the node type appears on the left side of each
row, providing visual indication of the node type.
7.2.1.
Context Menu of the Node
List
Right click on each row
of the node list opens a pop-up menu as shown in
Figure 7‑2
. This menu provides items for viewing station
details (see
9.3
), component which opens a component viewer for
the component of the selected node (see
9.4
), process list which opens a process list viewer
listing the processes defined in the station of the selected row (see
7.4
) and related drawings which opens a drawing list
viewer for the drawings of the selected node (see
7.5
).
7.3. Component List
This meu item opens a window
listing all components defined in the project as shown in
Figure 7‑3
.
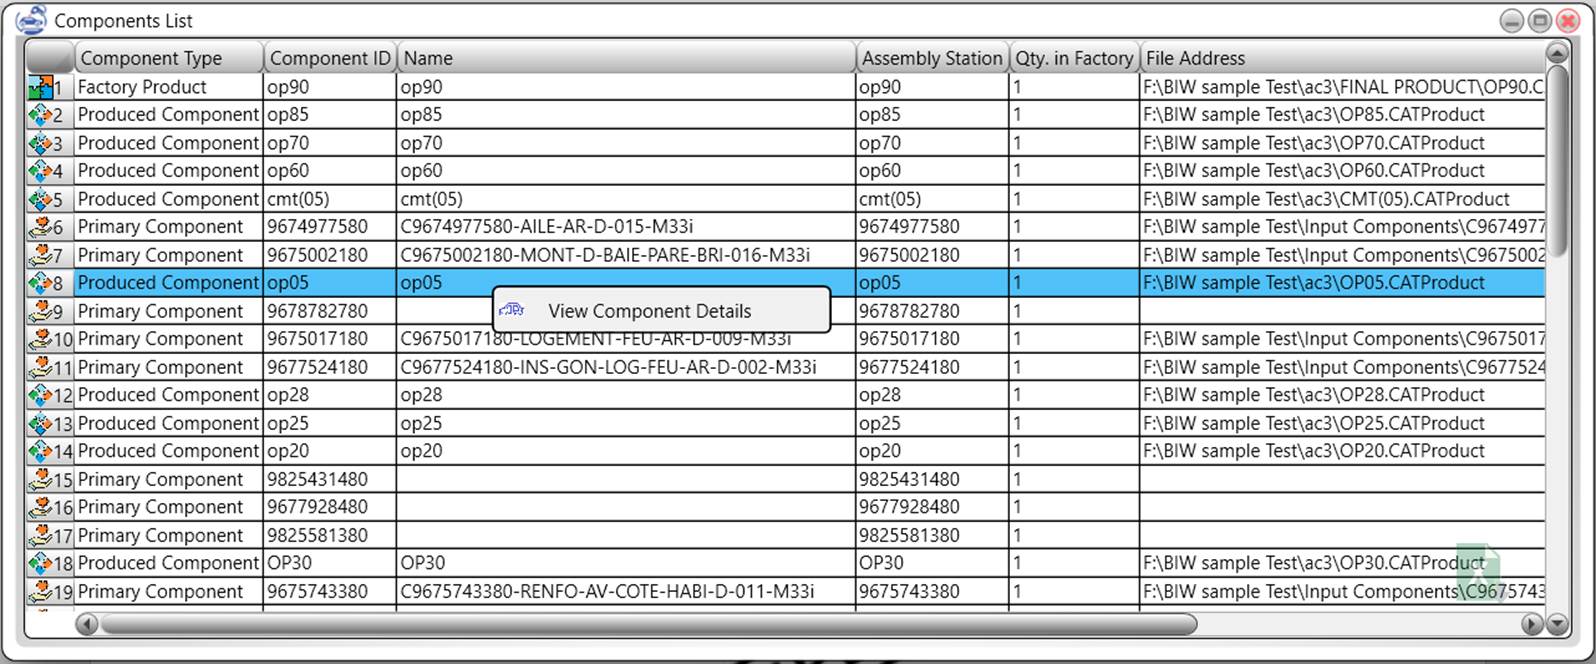
Figure 7 ‑ 3 Component List Viewer
Mouse Clicks
Double click on each row of the component list opens a component detail window for the component of the selected row. Right click on each row of the list opens a pop-up context menu.
7.3.1.
Context Menu of Component
List Viewer
Right click on each row
of the component list viewer opens a pop-up context menu as sown
Figure 7‑3
. The context menu provides an item for viewing
component details which opens a component viewer for component of the selected
row.
7.4. Process List
This meu item opens a window
listing all processes defined in the project as shown in
Figure 7‑4
.
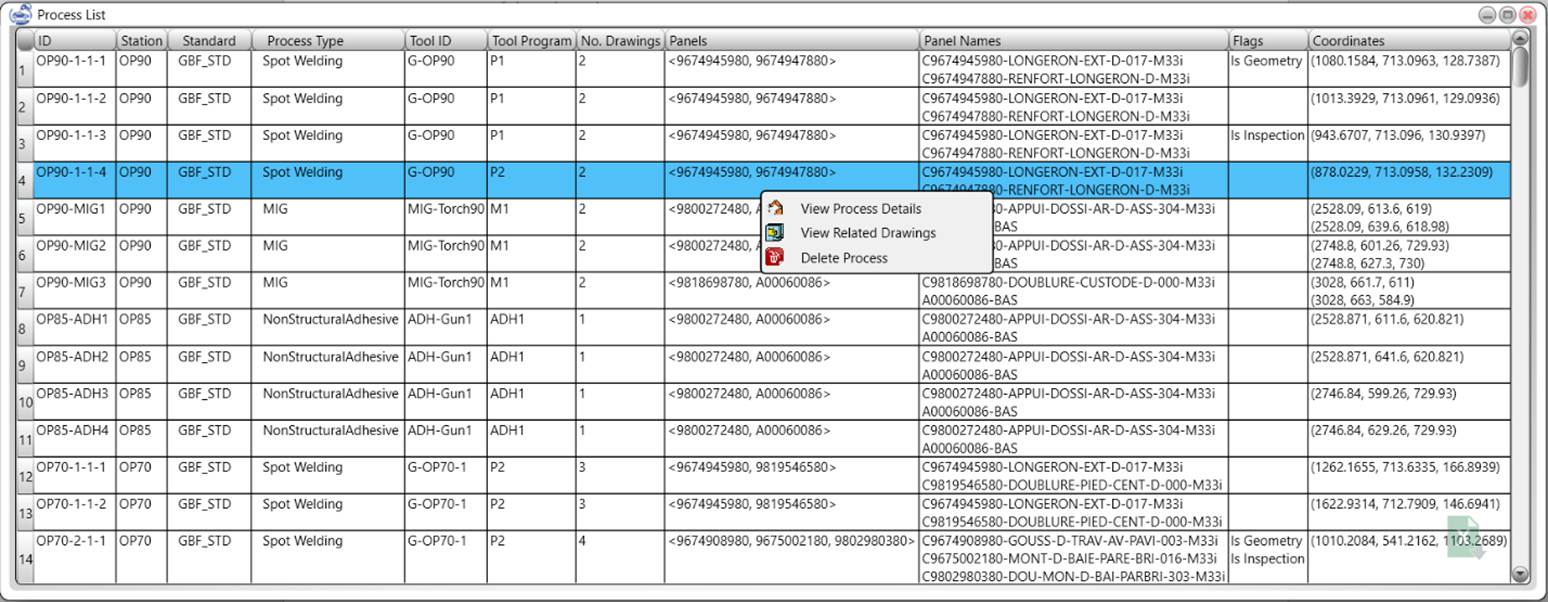
Figure 7 ‑ 4 Process List Viewer
Listed Process Information
Information listed for
each process in the process list viewer include the items listed in
Table 7‑2
:
Table 7 ‑ 2 information listed for each process in process list viewer
|
Column
Title |
Description |
|
ID |
The process ID |
|
Station |
The station in which the process
is assigned to take place |
|
Process Type |
Process type title (see sec.
6.1.3.7
) |
|
Tool ID |
ID of the tool assigned for the
process |
|
Tool Program |
Program ID of the process to
apply on the assigned tool |
|
No. Drawing |
Number of drawings in which the
process is indicated |
|
Panels |
ID of the panels on which the
process is defined |
|
Panel Names |
Name of the panels on which the
process is defined |
|
Flags |
Flag definitions of the process
(see sec.
6.1.3.9
) |
|
coordinates |
Coordinate list of coordinates
of the spot or curve on which the process is defined |
Mouse Clicks
Double click on each row of the process list opens a process detail window for the process on that row. Right click on each row of the process list opens a pop-up context menu.
7.4.1.
Context Menu of Process
List Viewer
Right click on each row
in the process list opens a pop-up menu providing items of “View Process
Details” which opens a process details viewer for the selected item (see
9.7
), “View Related Drawings” which opens a drawing
list viewer listing the drawings in which the selected process is indicated (see
7.5
), and “Delete Process” which deletes the selected
process from the project data. The context menu of the process list viewer is
shown in
Figure 7‑5
.
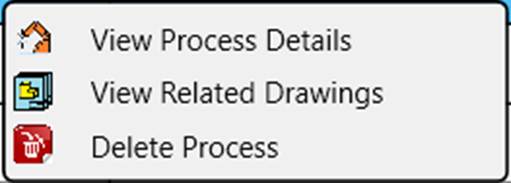
Figure 7 ‑ 5 Popup Menu of the proces list viewer
7.5. Process Drawings List
This menu item opens a
window, listing all the process drawings in the project as shown in
Figure 7‑6
.
Figure
7
‑
6
Process Drawings List Viewer
The information listed
for each drawing is listed in
Table 7‑3
.
Table 7 ‑ 3 information listed for drawings
|
Column
Title |
Description |
|
Validity |
If the drawing is valid a green
tick sign (
ü
) is shown, otherwise a warning
sign (
⚠️) |
|
Station |
ID of the station to which the
drawing belongs |
|
No. of Process |
Number of processes depicted in
the drawing |
|
View Point |
View point of the drawing (see
6.3.1.8
) |
|
View Type |
Type of the drawing view i.e.,
“Partial View” or “Whole View” |
|
Drawn By |
Name of the user who created the
drawing |
|
File Name |
File name of the Excel document
of the drawing |
Mouse Clicks
Double mouse click on
each row of the drawing list viewer opens the drawing details viewer for the
drawing of the selected row. Right click on each row of the drawing list viewer
opens a pop-up menu context menu.
7.5.1. Drawings Validation
The drawings are
continuously monitored by the program with respect to the assembly and process
plan of the project. If any changes in the process plan happens that result in
invalidation of some drawings, a warning sign (
⚠️
) appears in the validation column of the drawings
list. The number of invalidated drawings is shown also below the list. If the
most is kept over a drawing a brief report of the reason for invalidation of
the drawing is shown in the popping up tooltip as shown in
Figure 7‑7
.

Figure 7 ‑ 7 Indication of Invalidated Drawings
7.5.2. Show and Hide Obsolete Drawings
If a newer version of a drawing is created, the older drawings state is
changed to obsolete. The obsolete drawings are not shown in the drawing list
window. If there is a need to view the obsolete drawings, the check box of Show
obsolete drawings below the drawings list shoiuld be checked.
7.5.3.
Context Menu of the
Drawing List Viewer
Right click on each row of
the drawing list viewer opens a pop-up menu as shown in
Figure 7‑8
. This menu provides items of “View Drawing
Details” which opens a drawing details viewer for the selected item (see sec.
9.6
), “Open Drawing in Excel” which opens the drawing
as an editable Excel sheet in Excel application, “Open Drawing in PDF” which
opens the drawing as a PDF document in the pdf viewer and “Delete Drawing”. The
“Delete Drawing” should be clicked on carefully, because it irreversibly deletes
the drawings all belonging documents from the project storage.
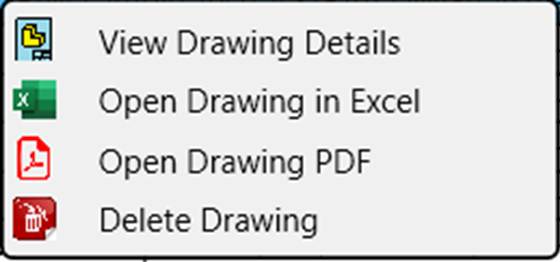
Figure 7 ‑ 8 Pop up menu of the drawing list viewer
8.
Options Menu
This menu provides an
item for adjusting the “settings” of the program as well as useful tools for
monitoring the connection to Catia software and hide or unhide it, as well as
an item for unhiding the Excel program in case is running in hidden mode.
8.1. Settings
The settings menu item in
the options menu opens the settings window which provides tools for adjusting
settings of the project and program in several tabs as shown in
Figure 8‑1
.
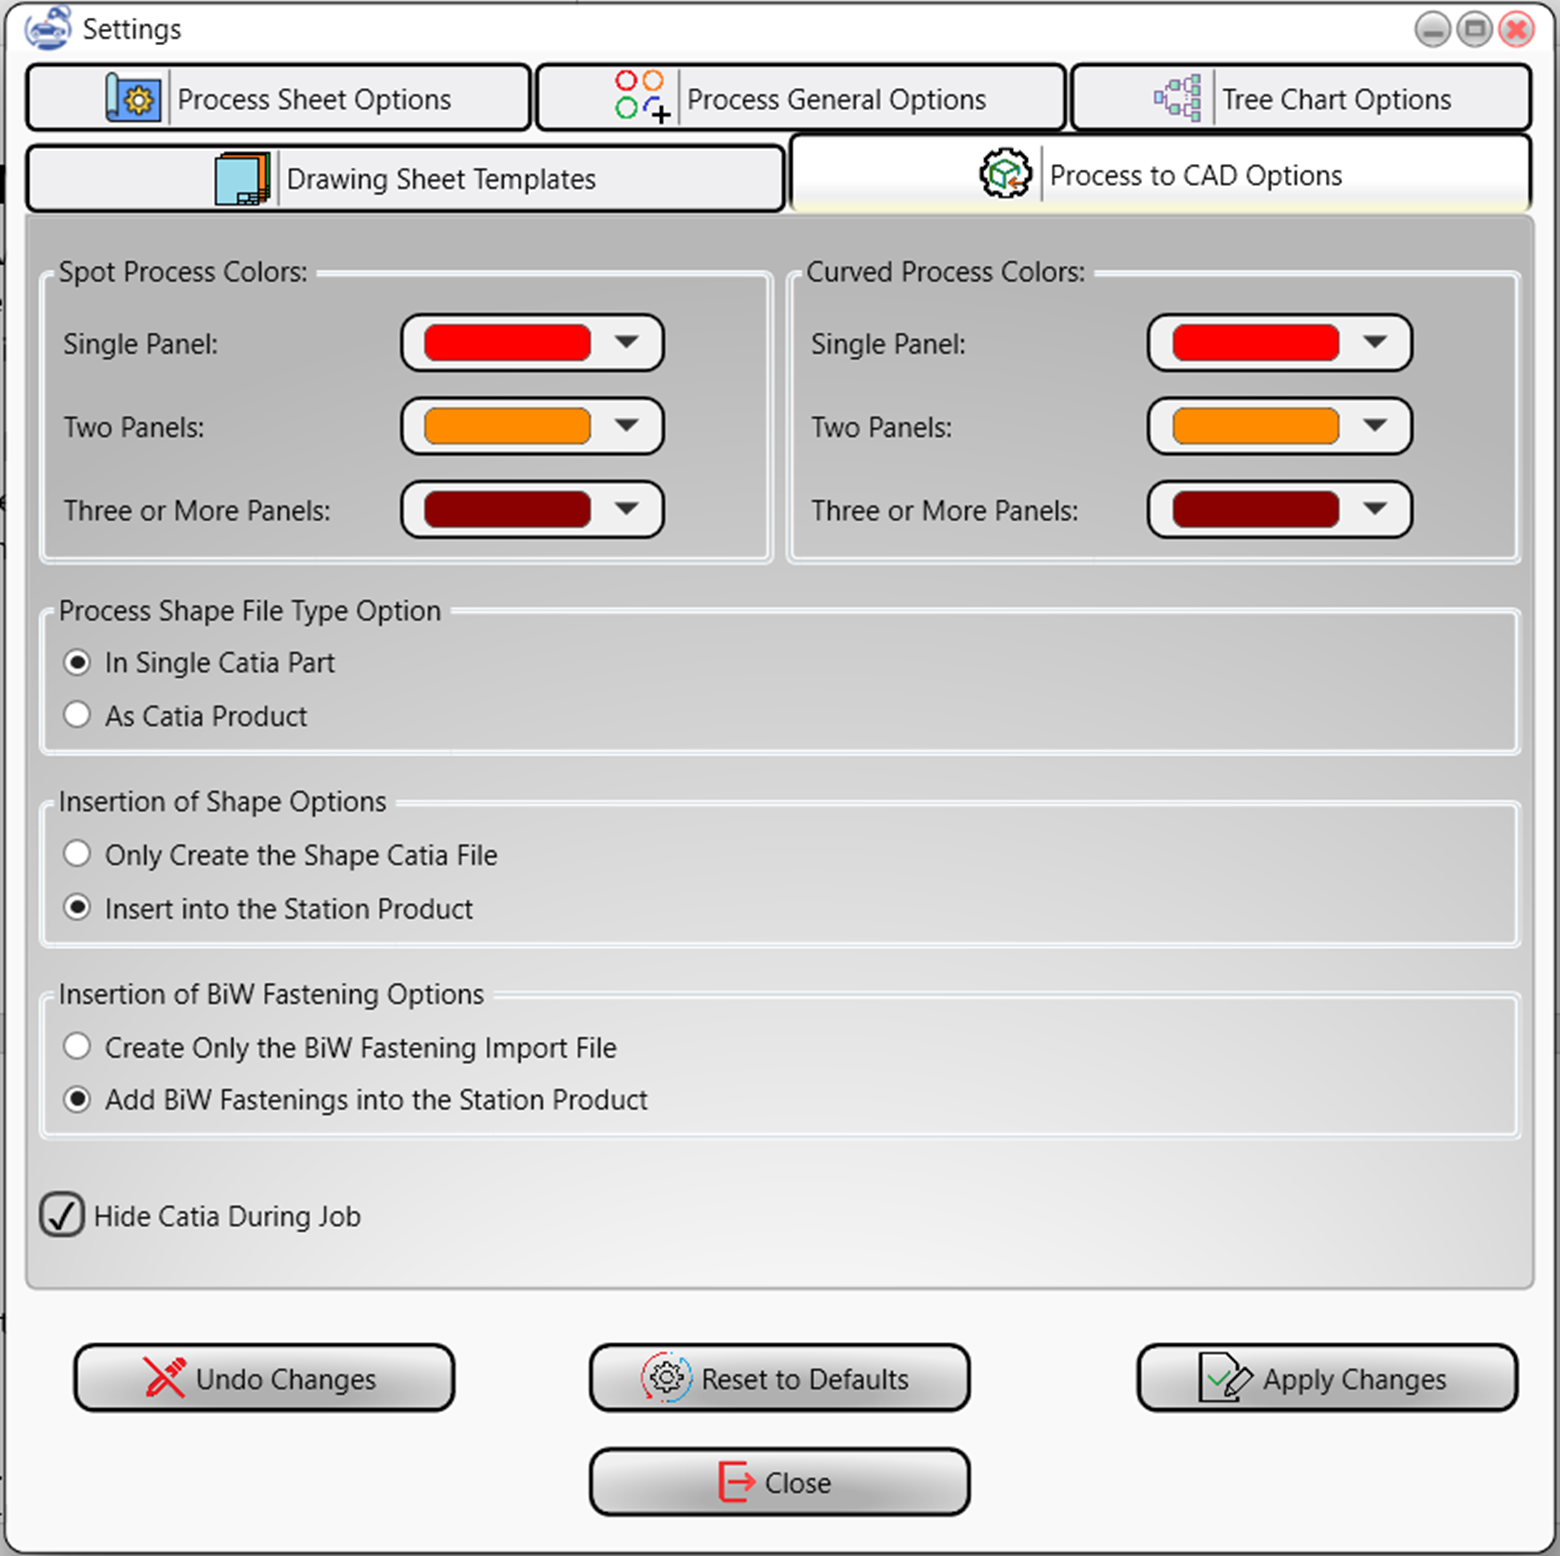
Figure
8
‑
1
Settings Window
On bottom of the page there are several
buttons for applying settings, reset to defaults or canceling the changes.
8.1.1. Settings Page Buttons
On bottom of the page
there are several buttons for applying settings, reset to defaults or canceling
the changes as shown in
Figure 8‑1
. The buttons are explained below.
Reset to Defaults
A default value is
associated to every item in the settings of the program. Whenever this button
is clicked on, the settings of the open tab are reset to the default values.
Apply changes
This button ion activated
in case the user has changed some of setting items. By clicking this item, the
changes are applied and saved to the current settings of the project.
Undo Changes
Clicking this button
cancels the changes in the settings page and the current settings of the
project are restored to the setting selections of the page.
Close
This button closes the
settings window. If there are some changes in the settings page that are not
applied to the project, a message box pops up asking the user whether to
discard changes and close the settings window or cancel the closing in order to
allow the user to apply the changes.
8.1.2. Tree Chart Options Tab
Three chart options page
is shown in
Figure 8‑2
. the options in this window tab are explained
here.
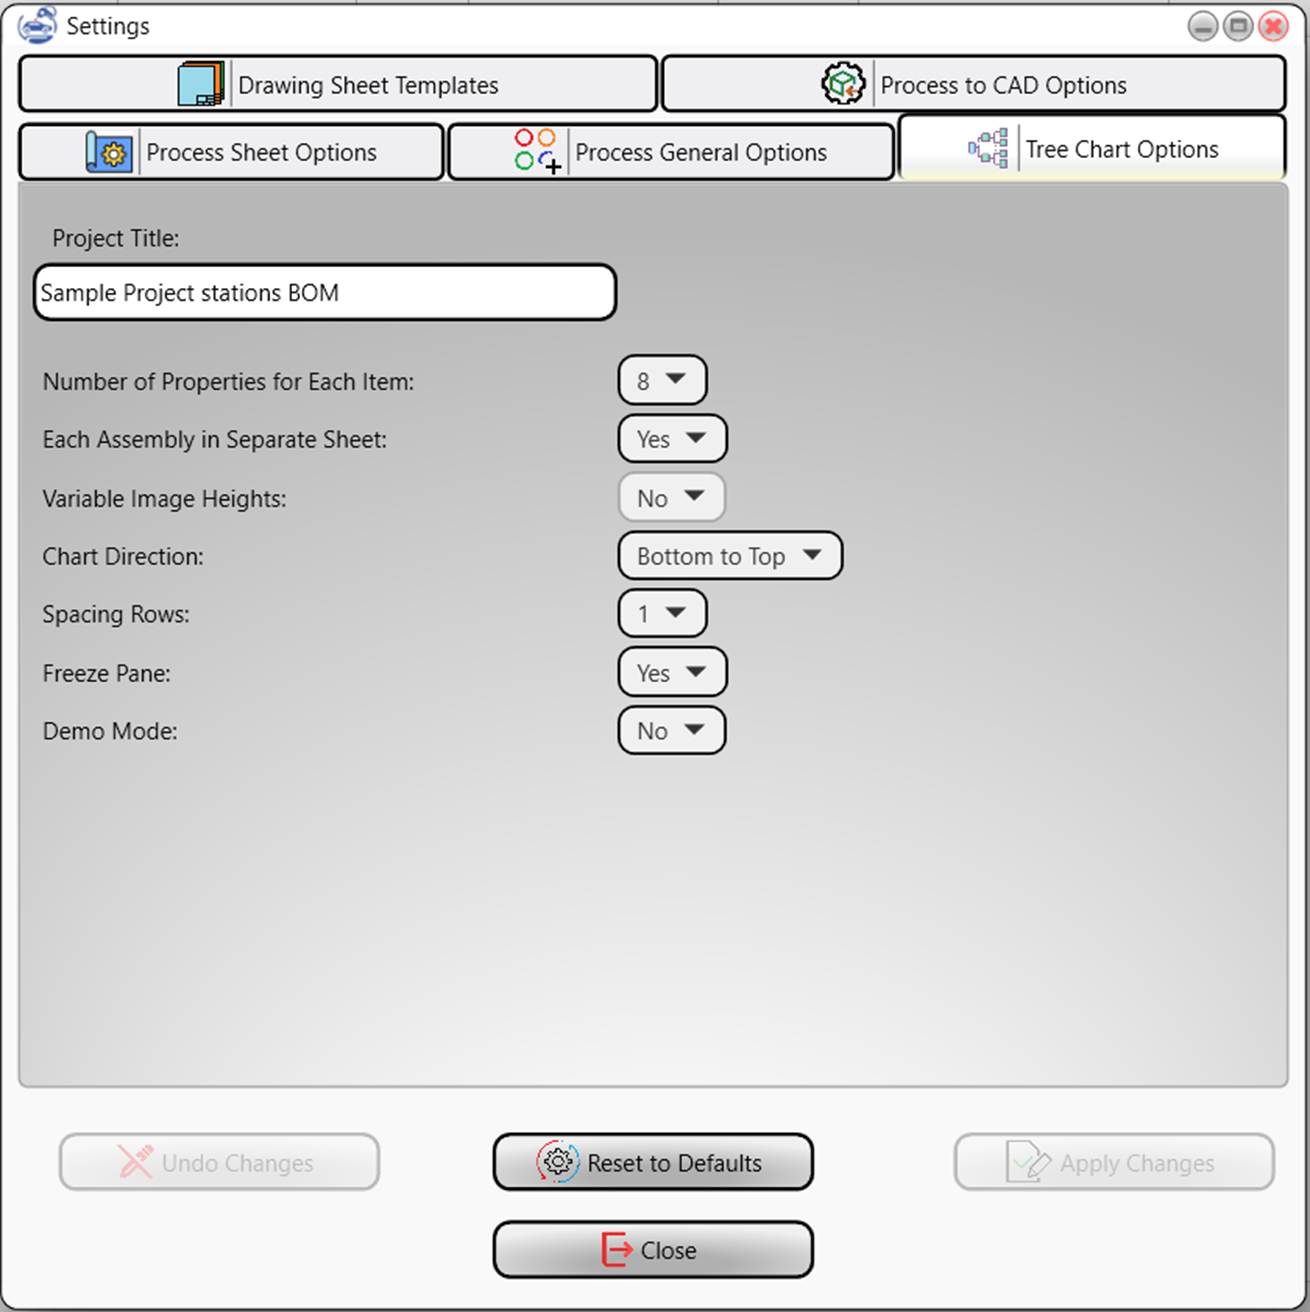
Figure 8 ‑ 2 Tree chart options tab
Create Each Assembly in Separate Sheet
If this option is set to
yes then the tree chart of each factory product or subassembly branch is
created in a separate excel sheet. Otherwise, the chart of all the subassembly
and factory products are created in a single sheet.
Number of properties for each item
This item determines number of properties of
each tree node to be listed in the component info area. The more properties
selected, the more rows of Excel are dedicated to the tree node and the bigger
will be the inserted image. By default, it is set to 8 which results in a
moderate uniform size of the node images. If this value is set to “Auto
Calculate” the number of rows is determined according the selected option of
“Variable Images Height”.
Variable Image Height
This option is active
only if “the number of properties for each item” is set to “Auto Calculate”. If
it is set to “No”, then the program finds the component with highest number of
properties and uses this as the number for all tree nodes uniformly.
If this option is set to
yes then the number of properties rows for each node is determined by the
defined properties of that node, resulting to a nonuniform size of component
images in the tree chart.
Chart Direction
If this option is set to
“Bottom to top” the chart starts from the lowest level components and ends at
the bottom with the factory product. If this option is set to “top to bottom”,
then the factory product is places on the first row of the chart and the lowest
tree levels appear at the bottom of the chart.
Spacing rows
The number of
intermittent rows between tree nodes. By default, it is set to 1.
Freeze pane
This title freezes the
title and component info panes.
Demo mode
If this option is set to
“yes”, then the excel sheet remains active during creation of chart and the
process of drawing the chart can be seen by user in a moderate speed. The chart
creation takes a considerably longer time with this option set, and if user
clicks in the excel sheet during the progress the chart creation is
interrupted.
Chart Title
The desired title of the
chart can be written in this input. By default, the chart title is set as the
project title.
8.1.3. Drawing Sheet Templates Tab
This page tab provides options
for managing drawings sheet templates as shown in
Figure 8‑3
. On top of the page the controls for selection of
the drawing’s logo are placed and the tools for managing the sheet templates
appear beneath of them.
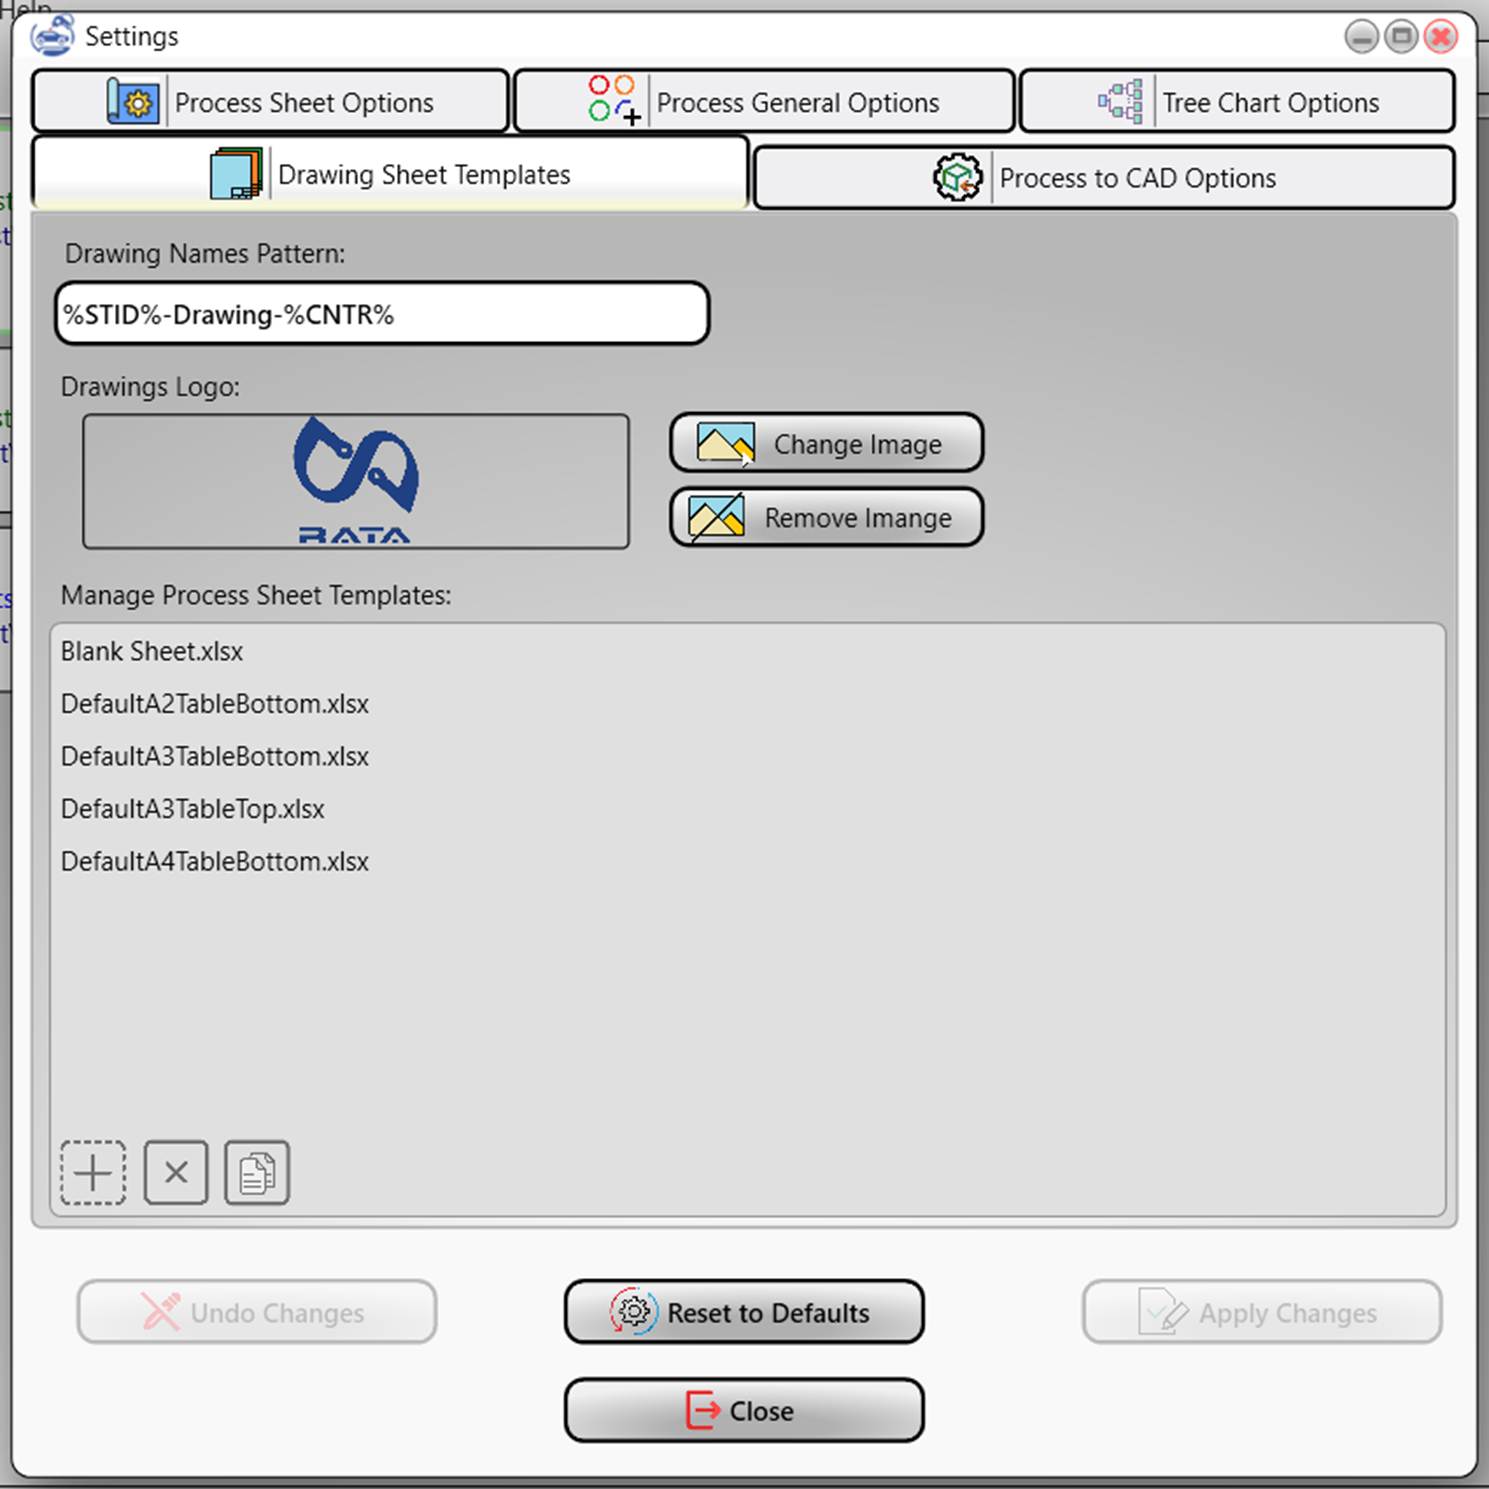
Figure 8 ‑ 3 Drawing sheet templates tab
8.1.3.1.
Drawing Names Pattern
Whenever a new drawing is
being created, a default drawing name is suggested by program in the drawing
creation dialog box. This auto-generated drawing name is generated with respect
to the pattern defined in the drawing names pattern here.
The name pattern is a
short text in which the text parts surrounded by a pair of % sign, are replaced
with corresponding information according to the
Table 8‑1
.
Table 8 ‑ 1 Drawing Name Pattern Place Holders
|
Place Holder |
Replaced by |
|
%CNTR% |
A counter number that starts with 1 and is
incremented by each new drawing with the same name pattern |
|
%STID% |
This place holder is replaced by station ID of
the station for which the drawing is created |
|
%CNAME% |
This place holder is replaced by component name
for which the drawing is created |
8.1.3.2.
Drawings Logo
Any image file of types JPEG,
PNG, GIF or BMP may be selected for logo of the drawings. The selected image
will be used to fill the logo area in the sheet templates. A preview of the
image is shown in the rectangle on the upper left side of the sheet temples
options tab. Selection of the image or removal or change of the logo image is
possible via two buttons of “change image” and “remove image” next to the
rectangle of the logo preview.
8.1.3.3.
Manage Process Sheet
Templates
A list of available
drawing templates appears in the manage process sheet templates area. A blank
sheet template and several templates with names starting with “Default” are
included in the list as out of the box available templates of the program. More
templates can be added or removed to the list of the templates by clicking on
the buttons add item (
![]() )
or remove item (
)
or remove item (
![]() ).
A further copy button (
).
A further copy button (
![]() )
in available for copying the selected template in to any desired folder. The
copied template can be edited or used as a start point for making new
templates.
)
in available for copying the selected template in to any desired folder. The
copied template can be edited or used as a start point for making new
templates.
8.1.3.4.
Process Sheet Templates
format
A process sheet template
is an Excel sheet in which the areas for placement of the drawing details are
indicated by writing corresponding tags in the areas. The template sheet should be the first sheet
in the Excel file and it is highly recommended that the template sheet be the
only sheet in the Excel file of the template.
The areas in the template sheet include “content”
area which is the area in which the drawing body is created, “drawing by” area
in which the name of the used creating the drawing is written, “drawing date”
area in which the date and time of creation of the drawing is written,
“station” area in which the ID of the station to which the drawing belongs is
written, “Project Name” area in which the name of the project is written and
the “logo” area in which the logo image will be inserted.
The available tag
definitions are listed in table:
Table 8 ‑ 2 Tag definitions in the template sheets
|
Tag |
Meaning |
Merged
Cells |
|
<CONTENT> |
Defines the upper left corner
cell of the content area |
Not Allowed |
|
</CONTENT> |
Defines the lower right corner
cell of the content area |
Not Allowed |
|
<PROJNAME> |
Defines the area of the project
name in which project name will be written |
Allowed |
|
<STATION> |
Defines the station area in
which station ID will be written |
Allowed |
|
<DWGBY> |
Defines the drawing by area in
which the name of user who creates the drawing is written |
Allowed |
|
<DWGDATE> |
Defines the drawing date area in
which the date and time of the creation of the drawing is written |
Allowed |
|
<LOGO> |
Defines the logo area in which
the logo image is inserted |
Allowed |
If any of the tag
definition is missing in the template sheet the program ignores insertion of
the corresponding data, except for the content tag which if
is missing in the template sheet the template will be considered as a blank
sheet.
8.1.4. Process Sheet Options Tab
The options for creation
of the process sheet drawings are adjustable in the process sheet options tab
shown in
Figure 8‑4
. The items in this page are explained here.
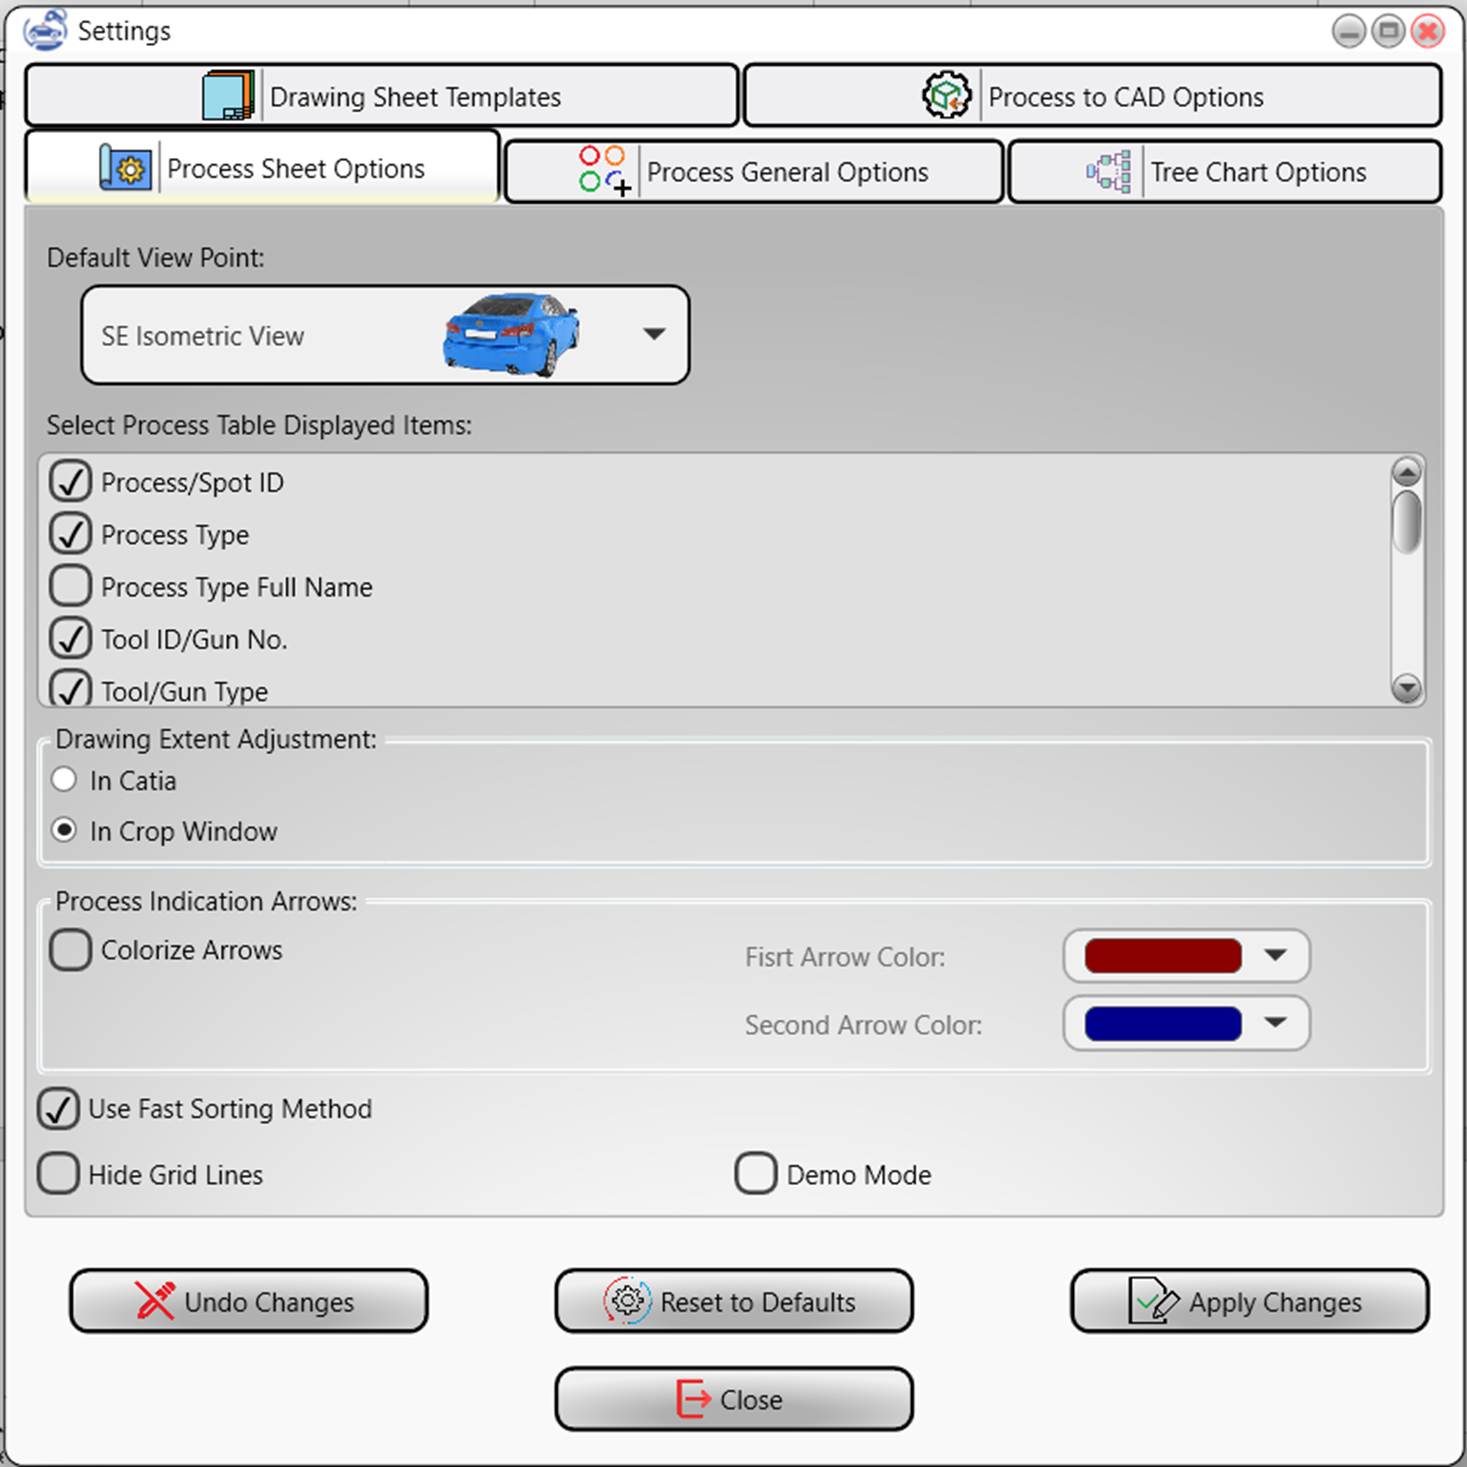
Figure 8 ‑ 4 Process sheet options tab
8.1.4.1.
Default View Point
The default view point selection combo appears on top of the process sheet options page. This combo provides a list of frequently used viewpoints in engineering drafting. A small car image from the corresponding view point is shown for each listed view point. A custom view point option is also given at the end of the list, by choosing of which, the user can create the drawing in any desired view as explained in section 6.3.1.9 .
The selected view point will be used as the default preselected view point in process sheet creation window.
Note: If the selected view point is changes in the process sheet creation dialogue box, the default view point is set to the view point of the last created process sheet. So, the default view point may also be changed by the selection combo in the process sheet creation dialogue box.
8.1.4.2. Selected Process Table Items
Information of each
process is displayed in a row of a table in the drawing with an arrow
connecting it to the process position in the drawing. The items displayed in
the information can be selected in this control. The information titles are
listed with a check box next to each, which when checked the information will
appear in the drawings. The selectable titles are listed in the table:
Table 8 ‑ 3 The available process information to display drawings
|
Info Title |
Description |
|
Process/Spot ID |
ID of the process |
|
Process Type |
Process type acronym (see
6.1.3.7
) |
|
Process Type Full Name |
Process type description (see
6.1.3.7
) |
|
Tool ID/Gun No. |
Tool ID |
|
Tool/Gun Type |
Tool Type |
|
Tool Generic Name |
Tool Generic Name |
|
Tool Manufacturer |
Tool Manufacturer |
|
Tool Manufacturer Type Code |
Tool Manufacturer Type Code |
|
Tool Program |
Tool Program ID |
|
Diameter |
Diameter of spot or curve
thickness of the process |
|
Flags |
List of flag definitions of the
process |
8.1.4.3. Drawing Extent Adjustment
In case a partial drawing (see 6.3.2 ) is being created, two options are available for adjustment of the drawing extents.
In Catia
If checked, the drafting
window in Catia is opened with a widget appearing on top, that allows rotating,
sizing and adjusting the extent of the drawing inside sheet borders.
In Crop Window
If checked, the drawing
is opened inside a window in program with crop tool for selection of the
drawing extents.
8.1.4.4. Process Indication Arrows
The option for arrow colors in the drawings is adjustable in this control. If the “Colorize Arrows” option is unchecked the arrows will be drawn black, otherwise the color selection combos are activated allowing selection of arrow colors. Two colors can be selected for arrows which will be alternatingly applied to the arrows in the drawings.
8.1.4.5. Other options
The remaining options of creation of the drawings include:
Use Fast Sorting Method
If this option is checked the program uses a fast-sorting algorithm for ordering the process definition tables in the drawings and the arrows thereof. The table orders may be slightly different from the case this option is unchecked.
Hide Grid Lines
If this option is checked the grid lines in the excel sheet of the drawings will be hidden.
Demo Mode
This option is available in special releases of the program
and if checked the program demonstrates the steps of the creation of the
drawings including the sorting process of the table orders and arrows.
8.1.5. Process to CAD Options Tab
The options of exporting
process to CAD files are adjustable in Process to CAD options page shown in
Figure 8‑5
.
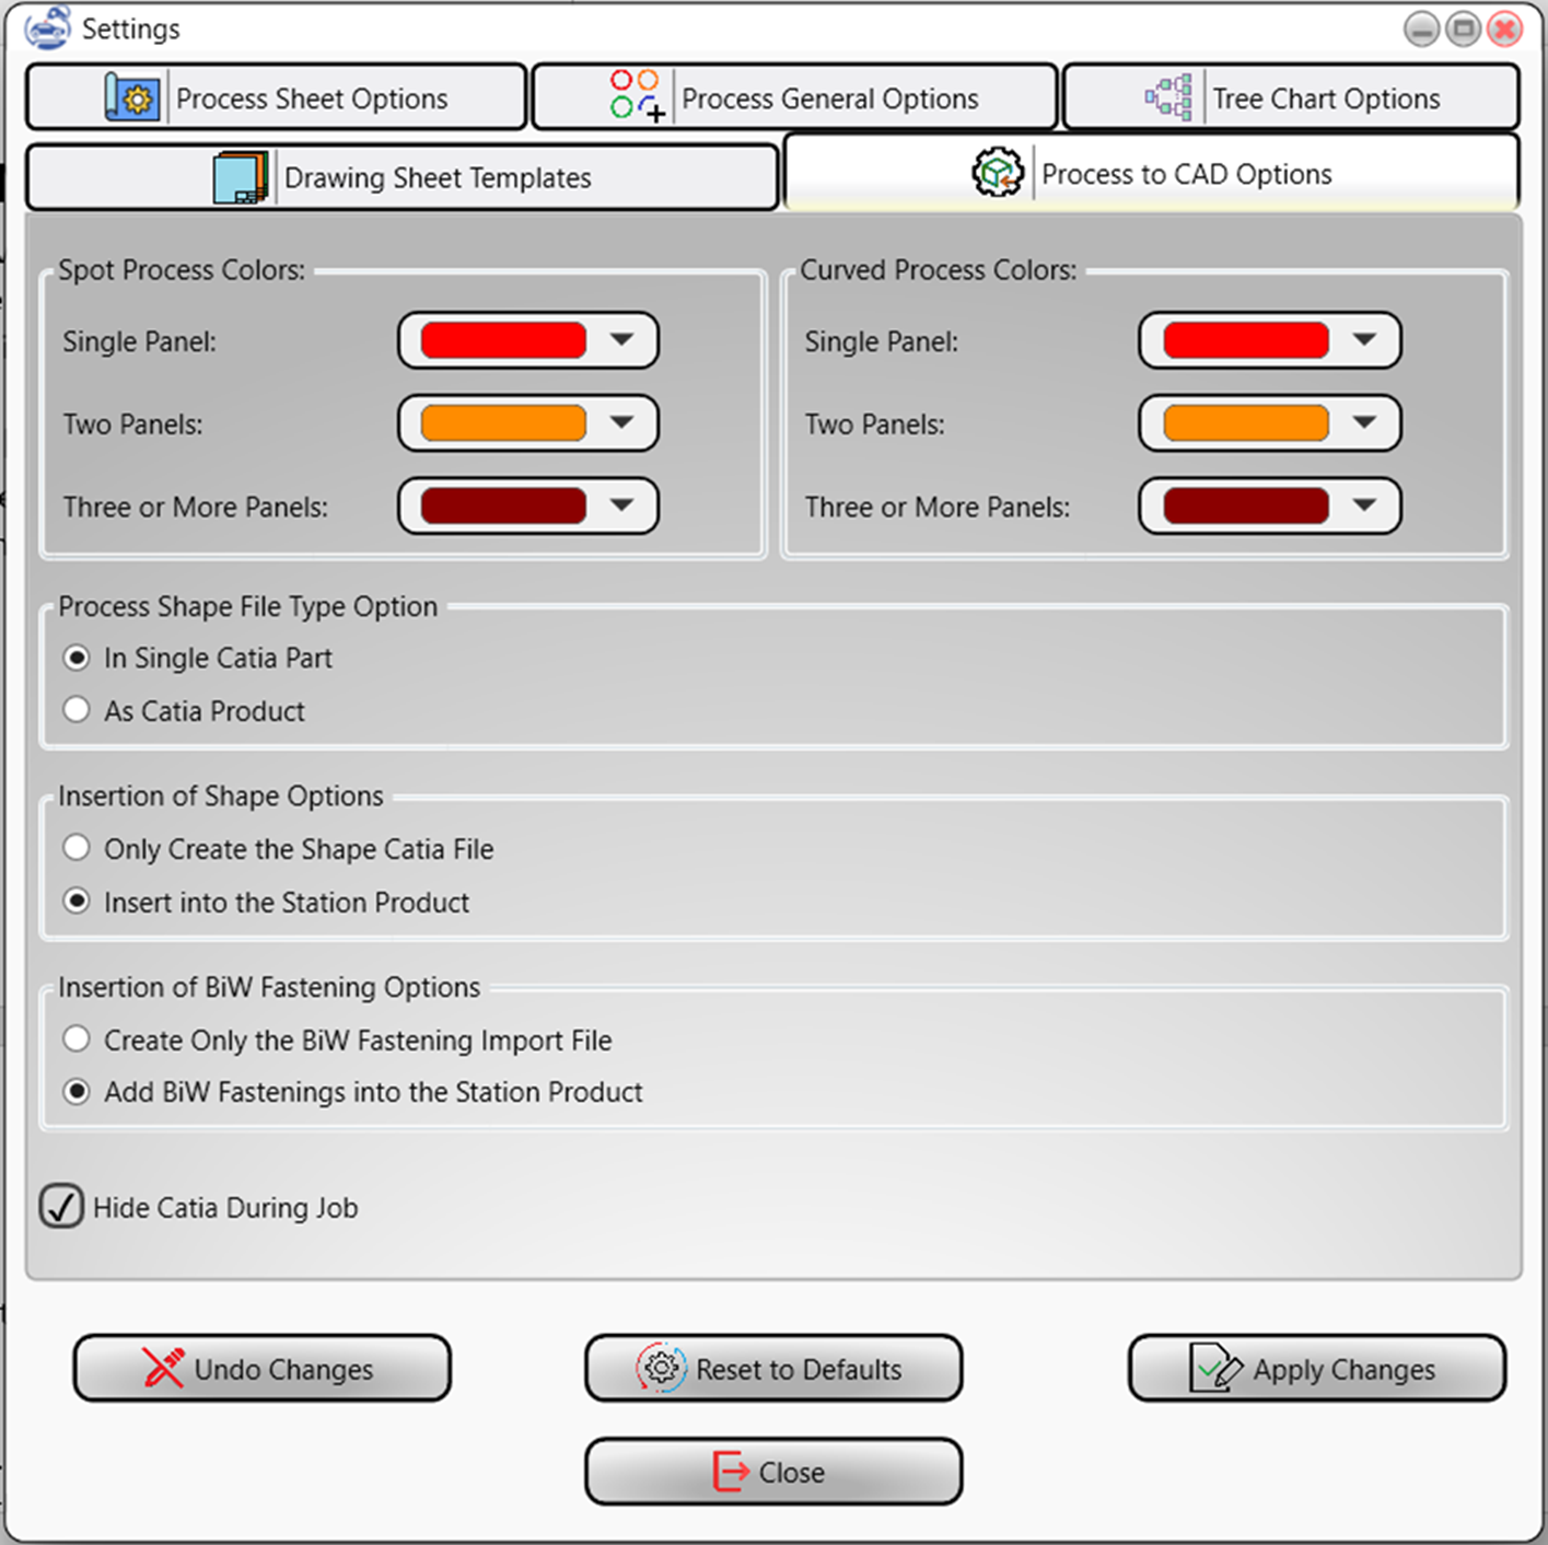
Figure
8
‑
5
Process to CAD options
8.1.5.1.
Spot Process Colors
In this area there are
three color selection combos which allow to select the color for spot process
types for cases of process application on single panel, two panels and three or
more panels. The sphere shapes created when applying process to cad files by
“Balls and Shapes” method are colored according to this color selections.
8.1.5.2.
Curved Process Colors
In this area there are
three color selection combos which allow to select the color for curved process
types for cases of process application on single panel, two panels and three or
more panels. The worm shapes created when applying process to cad files by
“Balls and Shapes” method are colored according to this color selections.
8.1.5.3.
Process Shape File Type
Option
This option allows to
select the shapes to be created in a single Catia part file or in a product
file. In case of the first choice all the process definitions are created in a CATPart file and a body is created for each process. In the
latter choice a separate CATPart file is created for
each process definition and a CATProduct file will be
created to hold them all.
Note:
This option applies only when apply process to
CAD by “Balls and Shapes” is executed. In case of apply process to CAD by “BiW Fastening”, this option is ineffective.
8.1.5.4.
Insertion of Shape Options
If this option is set to
“Only Create the Shape Catia File”, the shape CAD Files (either CATPart or CATProduct) are
created but are not inserted to the target station component CAD file. Whereas,
is the option is set to “Insert into the Station Product” the created process
CAD files are inserted to the station component CAD file.
Note:
This option applies only when apply process to
CAD by “Balls and Shapes” is executed. In case of apply process to CAD by “BiW Fastening”, this option is ineffective.
8.1.5.5.
Insertion of BiW Fastening
Options
If the option is set to
“Create Only the BiW Fastening Import File”, a BiW Fastening import file in text format is created but
will not be imported to the corresponding station component CATProduct.
Whereas the “Add BiW Fastening into the Station
Product” options, imports the BiW fastenings into the
station product CAD file.
8.1.5.6.
Other Options
Hide Catia During Job
If this option is checked
the Catia application will be hidden during creation and insertion of the
process shapes or BiW fastenings.
8.1.6. Process General Options Tab
Process incorporation
options which include the options and settings for importing process
definitions into the project data and other options like tolerances are
available in this page.
8.1.6.1.
Process Incorporation Options
Process incorporation
options include the options and settings for importing process definitions into
the project data and other option. Following options are available:
Prefer resolving ambiguity by address clue
If this option is
checked, when the program finds multiple instances of a panel in the station of
definition of a process, it first checks if an address clue is given for the
panel. If the address clue is given, the program uses the address clues to
specify panel addresses.
If this option is
unchecked, the program proceeds with finding the relevant panel by checking the
distance of panels from the position of the process definition and chooses the
closest panel. (See
6.1.3.4
)
Check Distance of Process and Panels
If this option is
checked, the program checks the distance of process positions for all read
processes and produces a warning, if the distance exceeds the warning
tolerance.
Process Distance Warning Tolerance
This option provides a
field in which the user can define the warning tolerance of the distance
between process position and the panel. If the measured distance exceeds this
tolerance a warning message will be generated in the operation report.
8.1.6.2.
Other Options
Include Node Address in Exporting Excel Sheets
If this option is
checked, full panel addresses are included in the panel name columns in the
process export excel sheets. This panel addresses are especially useful for
resolving panel ambiguities by using address clue. (See
6.1.3.4
)
Drawing Validation Process Displacement Tolerance
This option provides a
field for entering a tolerance value for process displacements. If displacement
of a process exceeds this tolerance value, the drawing validation procedures
mark the related drawings which invalid flag.
8.2. Catia Status Watcher
This item opens a Catia
status watcher window as shown in
Figure 8‑6
. This
window contains three big dots that indicate the status of the connection to
the Catia program. If there is no instance of Catia running, the first dot is
red and the other two are gray. As soon as an instance of Catia is started on
the computer this first dot turns green and the second dot turns red, which
indicates that Catia is not connected yet. When Catia is fully loaded and BIW-AP
program succeeds in connecting to it, the second dot turns green too. The last
dot on the bottom is green whenever Catia is visible and red if Catia is
running in invisible mode.
A Hide/Unhide Button at
the bottom of this window allows the user to hide or unhide the Catia program.
During the program operations which are done by exploiting Catia, the program
hides the Catia. In this case the user can unhide Catia by this bottom in order
to observe the operation progress in Catia, however this practice is not
recommended because if Catia is visible to user, the user may interfere into
the program operation in Catia.
An important use of
Hide/Unhide button is for cases the program is crashed or closed during
operation while Catia is hidden. In such cases a hidden instance of Catia
remains in the computer that can be unhidden by this button.
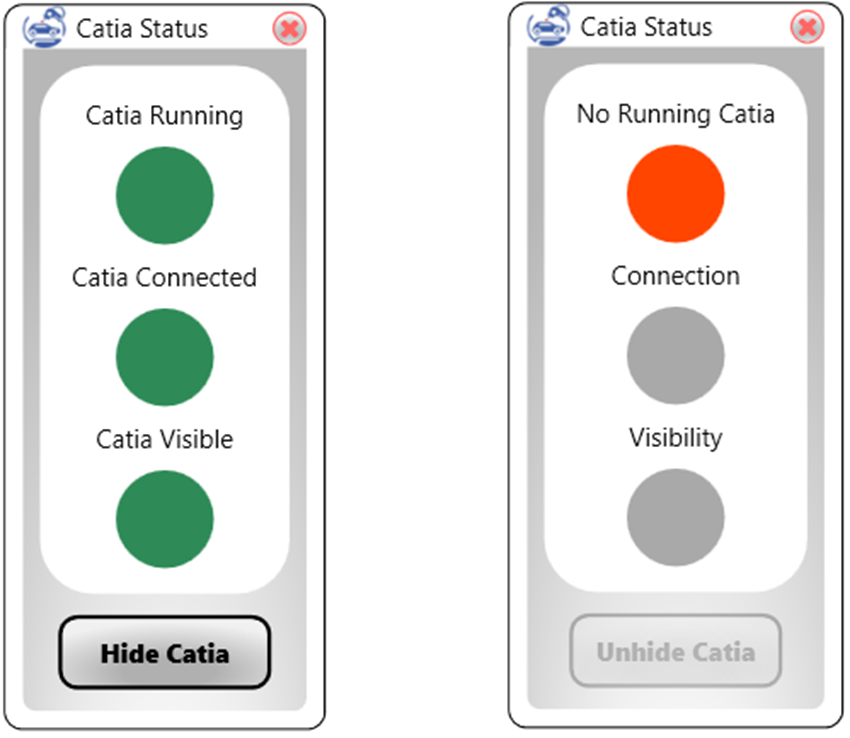
Figure
8
‑
6
Catia status watcher window
8.3. Unhide Excel
This menu item unhides
excel if there are hidden instances of excel program running. The program hides
excel during jobs that require exploitation of Excel application, like creation
of the drawings in Excel. In such cases if the program is stopped or crashes,
it may leave the Excel in hidden mode. This menu item is a useful tool in this
case to reveal the hidden Excel application instances.
If there are no hidden
Excel instances this menu item does nothing.
9.
Viewers
Details of each of
comprising elements of a project can be viewed in a corresponding viewer window
and if applicable be also edited
9.1. Project Info Viewer
Overall Project
information can be seen or edited in the project info window. This window can
be accessed through the menu path Project > Project Info. The project info
as shown in
Figure 9‑1
, include the project title, project file, project
folder and input folder as well as a brief statistics report of the project
contents.

Figure
9
‑
1
Project Info Viewer
Project title can be
directly edited in this window. If the project is already saved in a file or
reopened from a saved project file the project file text box shows the address
of the project file.
The project folder and
the input folder can be changes by clicking on the pencil icon (
![]() )
on the right side of the input fields. This opens a dialogue box for selecting
the folder locations. By changing the input or output folders the program
searches for the project components in the new folders and updates the project
information accordingly. For example, if the new project folder does not
include the project assembly files the component statuses will update to “File
no more available”. And the component images and drawings list will be revised
according to the images and drawings in the new project folder if available.
)
on the right side of the input fields. This opens a dialogue box for selecting
the folder locations. By changing the input or output folders the program
searches for the project components in the new folders and updates the project
information accordingly. For example, if the new project folder does not
include the project assembly files the component statuses will update to “File
no more available”. And the component images and drawings list will be revised
according to the images and drawings in the new project folder if available.
9.2. Tree Viewer
The family tree of the factory
product or its sub-branches can be viewed in a tree viewer. The main view of the
program as explained in section
3.2.1
, comprises a tree viewer showing the whole family
tree of the products in the project. More tree viewers can be opened in order
to view the tree structure of product components separately. In a tree viewer,
each station in the BiW line comprises a node in the
tree which gives a brief overview of the station information in a bubble. On
the left side of the bubble a picture of the assembled component in the station
is shown if available. More details of each station can be seen by adjusting
the setting in the view settings menu. The view settings menu pops up when
clicking on the gear sign (
![]() )
on the top right side of the data view area.
)
on the top right side of the data view area.
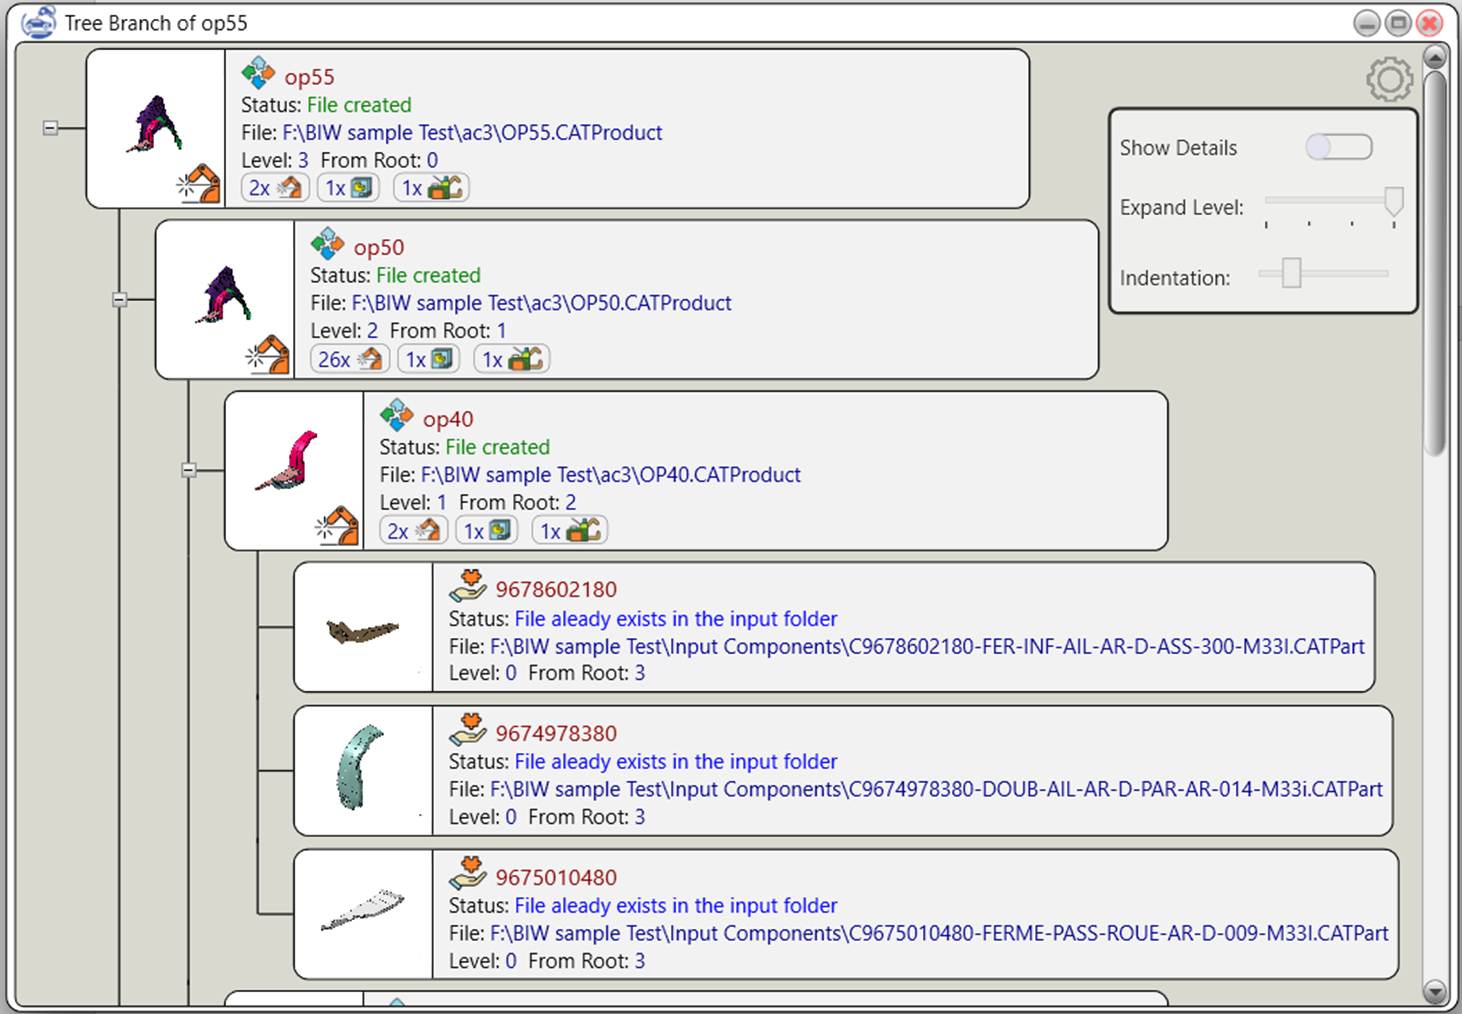
Figure
9
‑
2
A Tree Viewer Window
9.2.1. Tree node bubbles
The first line in the
bubble indicates the ID of the station and an icon on left side of it which
indicates the node type of the station or its assembled component. Node types
are explained in section
3.2.6
. Other information shown in the bubble include
status of the component CAD file, component file address and level, which
indicate the node level in the tree. In this program the tree leaves are
leveled 0 and the level number increases in the branches up to the tree root
which takes the highest number.
An alternative node level
is also defined as the level from root. In the level from root the root of the
tree is set to 0 and the level increases through branches of the tree up to the
tree leaves.
On the left side of the
bubble a picture of the assembled component in the station is shown if
available. If the mouse is hold over the image, a pop-up window will show a
larger image of it.
If there are some processes defined for the station, an icon of () appears on bottom left of the bubble. If mouse is hold on this icon a brief repot of the process will appear on the screen. More detailed report of the processes in the station is available through the pop-up menu item “View Process List.”
9.2.2. Tree Nodes Pop Up Menu
Right click on each tree
node bubble pops a menu up as shown in
Figure 9‑3
. This menu includes items for showing station and
component details, apply process to CAD files, create process drawings etc.
which are explained through this help document.
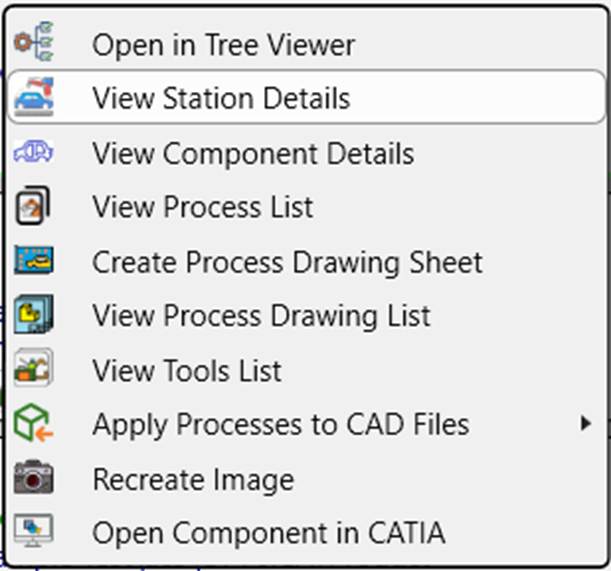
Figure 9 ‑ 3 Popup Menu Of Family Tree Nodes
9.2.3. Tree View Settings Menu
The view settings menu
pops up when clicking on the gear sign (
![]() )
on the top right side of the data view area. The options in this menu include a
slider button which toggles the showing of “more details” of stations on or
off. A slider which adjusts the expansion level of the tree. And a slider by
which the user can adjust the indentation of the tree branches. The tree view
settings menu is shown in
Figure 9‑4
.
)
on the top right side of the data view area. The options in this menu include a
slider button which toggles the showing of “more details” of stations on or
off. A slider which adjusts the expansion level of the tree. And a slider by
which the user can adjust the indentation of the tree branches. The tree view
settings menu is shown in
Figure 9‑4
.
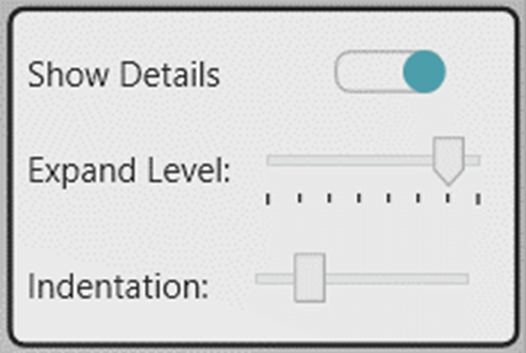
Figure
9
‑
4
Tree View Settings Menu
9.3. Station Viewer
Station details can be
seen in the station viewer window. This window can be opened through menu path
Project > Stations or through the same menu item in the context menu by
right clicking on tree view node bubbles. An example of a station viewer window
is shown in
Figure 9‑5
.
Figure
9
‑
5
A station viewer
On the top left of the
station viewer, a station selection combo box indicates the ID of the selected
station, and on the right a picture of the station product component is shown
if available.
ID of the station product
component and list of the child components is also shown in the station viewer
as well as the list of the BiW process definitions in
the station. Right click on each item in the list of child components or
process definitions opens a context menu with a menu item of “View Component
Details” or “View Process Details” respectively.
9.4. Component Info Viewer
Details of each component
throughout the project family tree can be viewed in component info viewer
windows. The component viewer can be opened through the corresponding menu item
in the tree viewer nodes context menu. It also can be opened through context
menu in the listing items in station viewers or report windows. A sample of
component viewer is shown in
Figure 9‑6
.
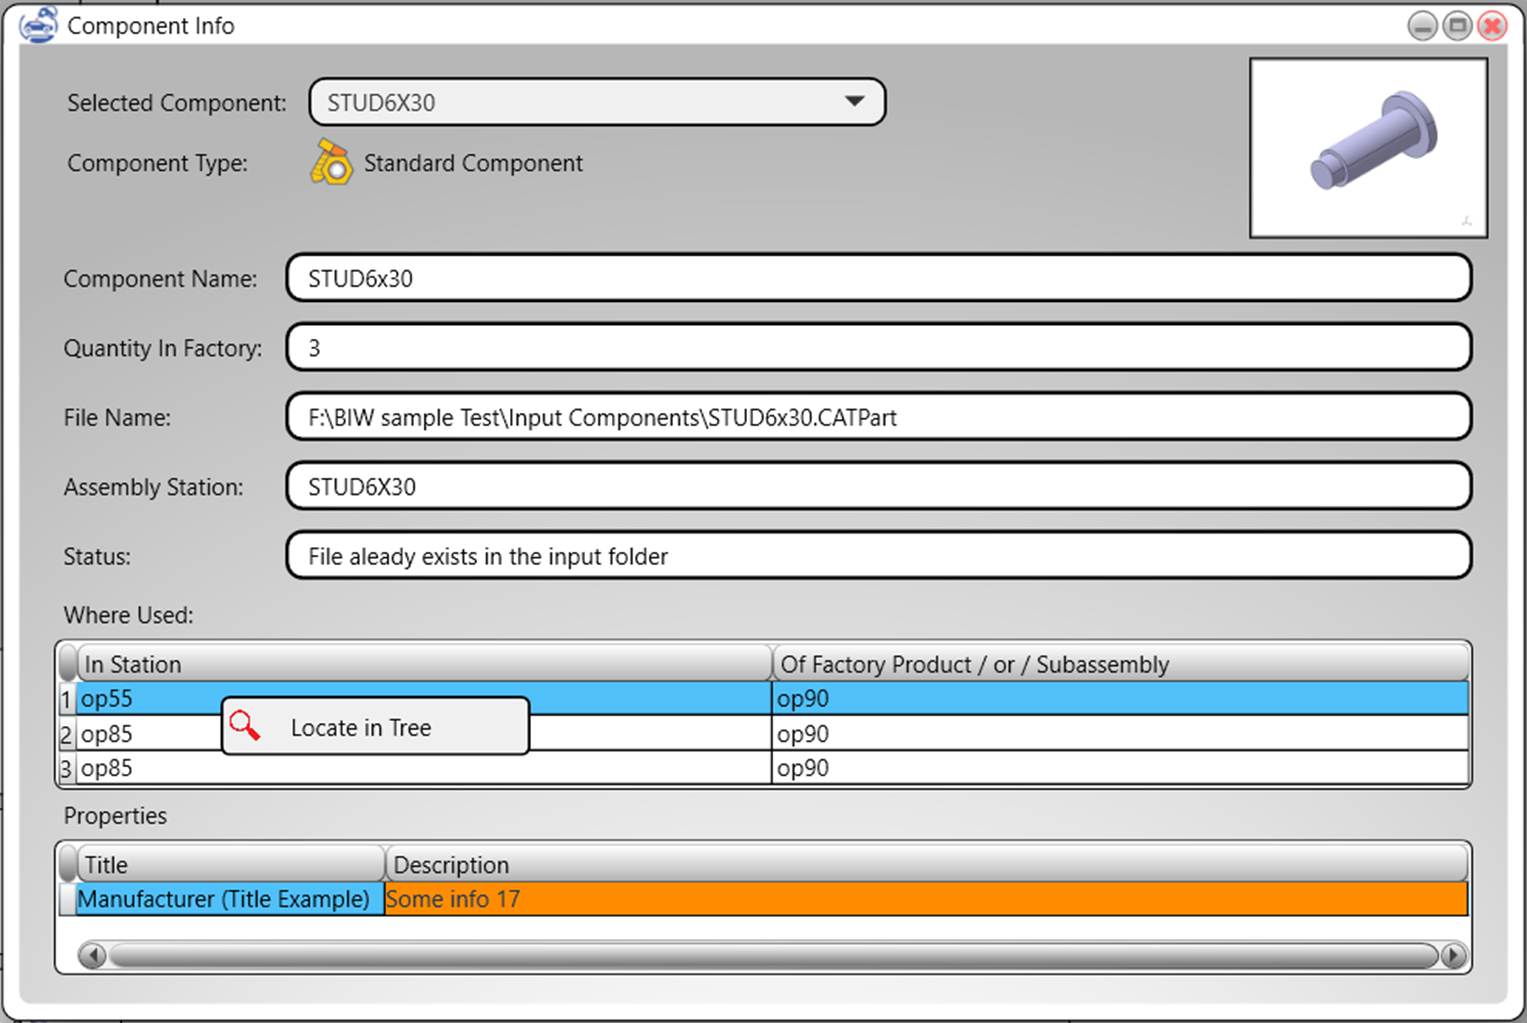
Figure 9 ‑ 6 Component info viewer
On the top left of the window a combo box indicates the ID of the selected component. The type of the component is also shown under the ID. On the top right of the window a picture of the component is shown if available.
Component information including the component name, quantity of the component used in the factory products, name of the components CAD file, and the assembly (i.e., The station in which the component is made) and the file status of the component, where used are shown in the component viewer, as well as the property list.
In the where used area, a list of the station in which the component is inserted in the products family tree is shown. A right click on each item of the list opens a pop-up menu with option of locate in tree. A click on this option finds and brings the instance of the component in the main view of the program and selects it in the tree viewer.
In the properties area, the list of the defined properties including the title and value of the property is shown. The color of each row corresponds to the color of the property. A right click on each row opens a pop-up menu with options for adding a new property or editing the selected property. As shown in Figure 9‑7 .
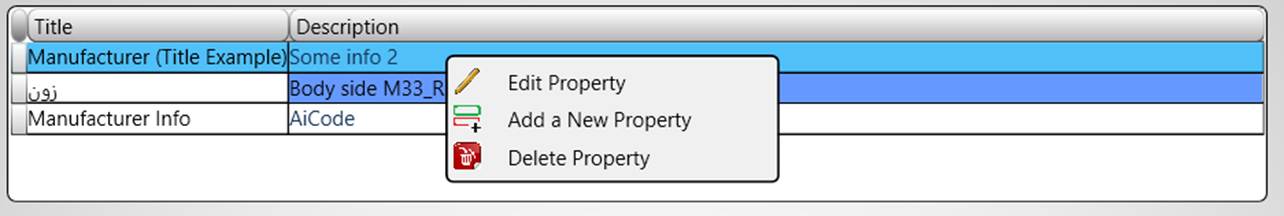
Figure 9 ‑ 7 Pop-up menu of the property list in component viewer
9.5. Property Viewer
The property viewer shown
in
Figure 9‑8
. This window allows to select a title for the
property, add a text for value of the property and choose the text foreground
and background colors.
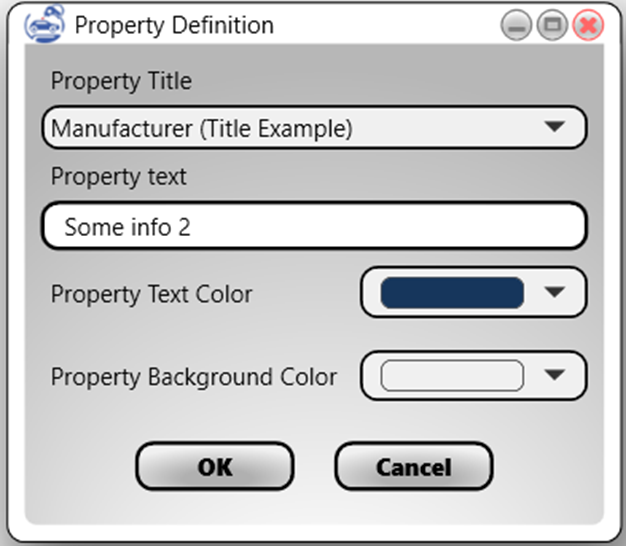
Figure 9 ‑ 8 Property Viewer/Editor
If a new title is to be
defined for the property, the “New Title” option may be selected on the end of
the list of predefined titles as shown in
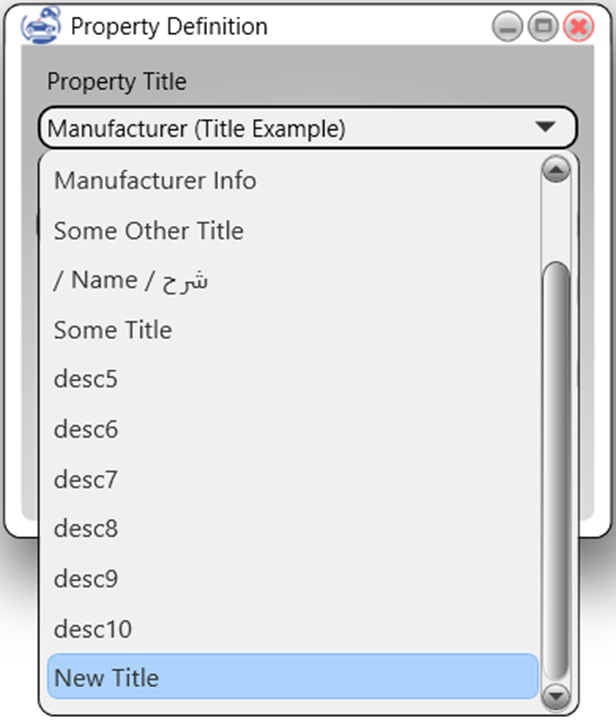
Figure 9 ‑ 9 New Title Selection for the Ptoperty Title
9.6. Drawing Viewer
The drawing viewer provides convenient tools to view the drawing and its details. The drawing viewer as shown in XXXX comprises four major view sections.
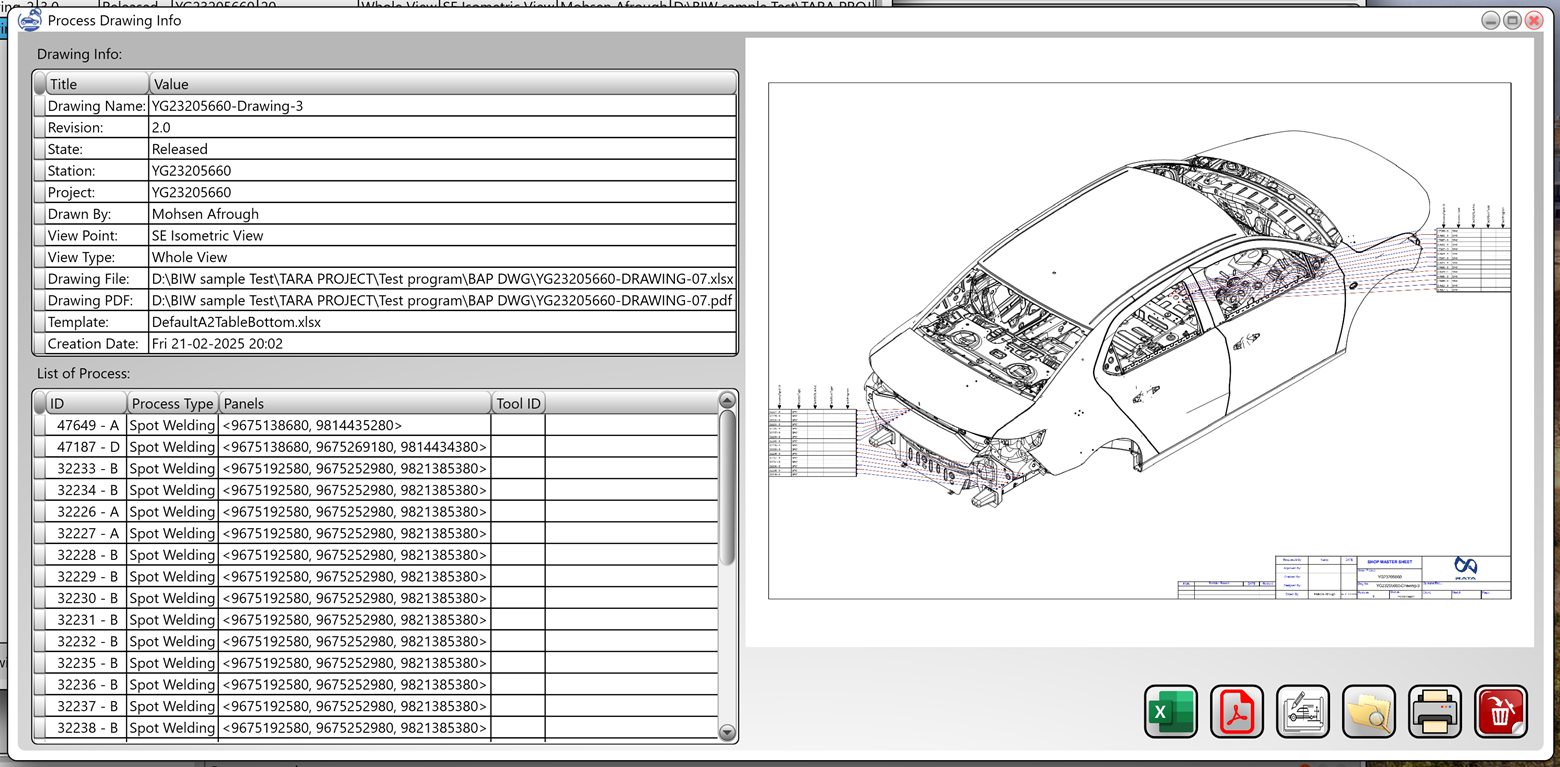
Figure 9 ‑ 10 Drawing Viewer
9.6.1. Drawing Info
On the right side the general information of the drawing like drawing name, revision, state, view point, file name etc. are listed in the “drawing info” section.
9.6.2. List of Processes
The processes that are shown in the drawing are listed in the “List of Processes” below the drawing info. Right click on each of listed processes, opens a pop up menu with an item to open the selected process in a process viewer to view its details. As shown in Figure 9‑11 .
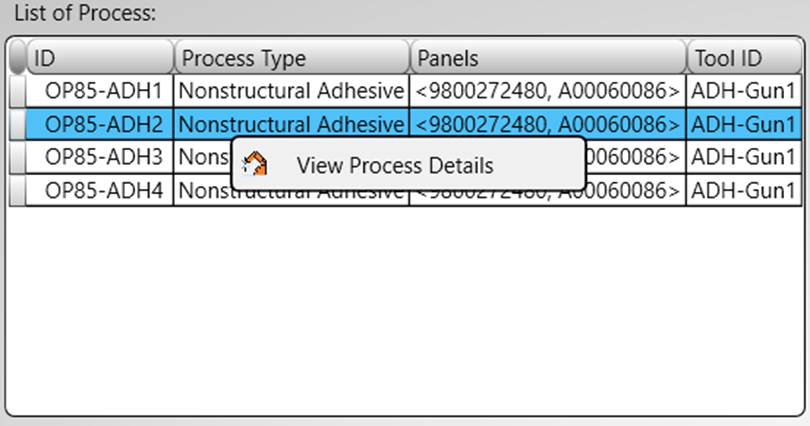
Figure 9 ‑ 11 Right Click on a Process in the List
If a process is invalid for the drawing in the list, a warning sign () appears on left side of the process. The reason for invalidation of the process can be acknowledged by holding the mouse over the warning sign. The total number of invalid process in the drawing is also indicated below the list of processes as shown in Figure 9‑12 .
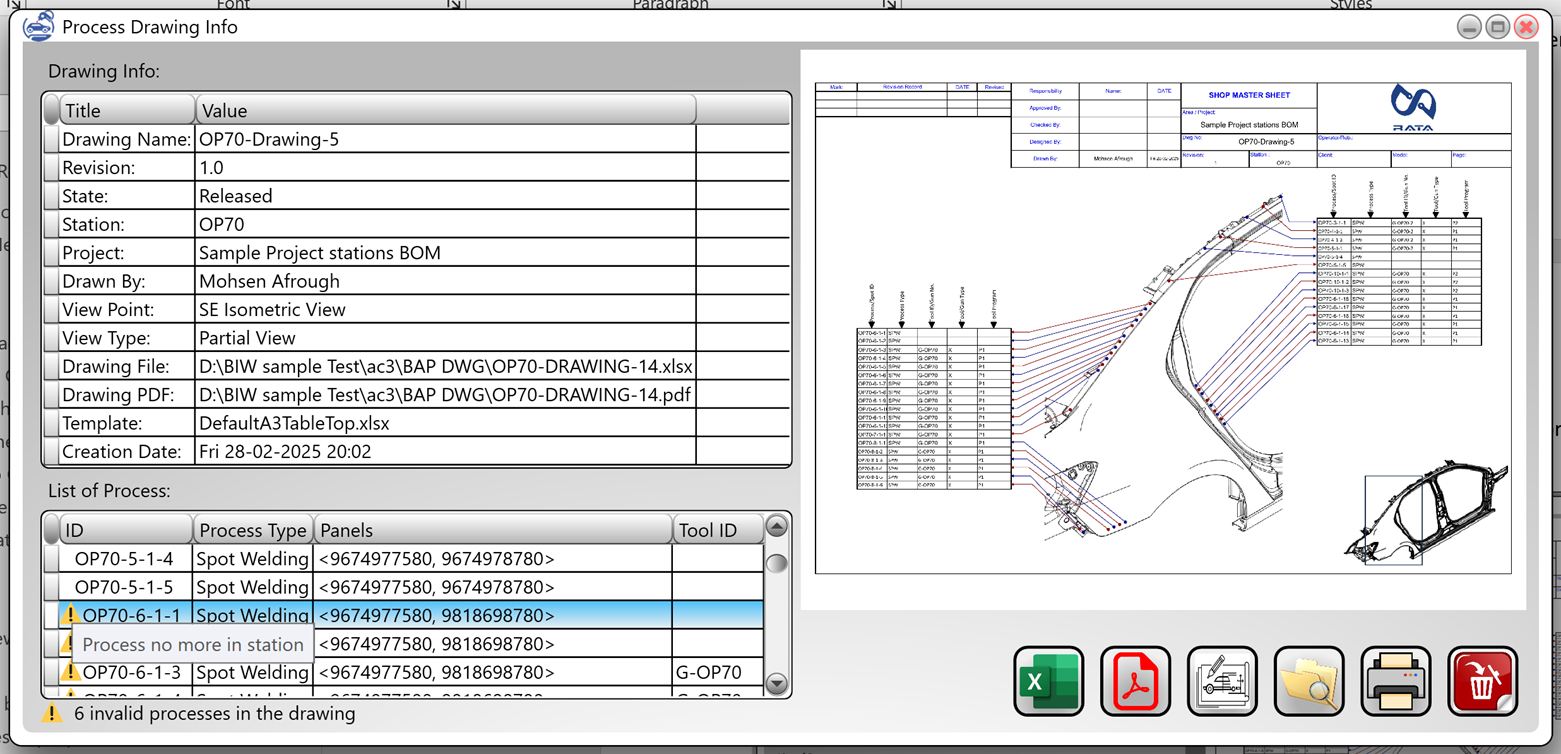
Figure 9 ‑ 12 Invalid process Definotions in a Drawing
9.6.3. Drawing Image View
The drawing image appears
on the right side of the drawing viewer window. An image of the drawing appears
in this section that can be zoomed in/out and panned by using mouse wheel and
gestures on it. A right click of mouse over the image resets the image and fits
it onto the image area.
9.6.4. Drawing Management Buttons
Several icon buttons
appear below the drawing image as shown in
Figure 9‑13
. These buttons respectively open the original
drawing in Excel, open the drawing as PDF, regenerate a new version of the
drawing, view the drawing file in file explorer, print and delete the drawing.

Figure 9 ‑ 13 Drawing Management Buttons
9.6.4.1.
Open in Excel
The drawing is originally
created in MS-Excel. A click on the open in Excel icon button (
![]() ),
opens the drawing in excel. The drawing info can be manipulated or edited in
excel, printed out or saved as a new sheet or on the original by the user.
),
opens the drawing in excel. The drawing info can be manipulated or edited in
excel, printed out or saved as a new sheet or on the original by the user.
9.6.4.2.
Open in PDF Viewer
A pdf file of the drawing
is already created by the BiW-AP program that is
opened in the PDF viewer by clicking on the view PDF button (
![]() ).
).
9.6.4.3.
Regenerate Drawing
The regenerate button (
![]() ),
allows to create a new revision of the drawing with the same name. The same
process as the current drawing, are preselected in the drawing creation dialog
box that opens by clicking on this icon.
),
allows to create a new revision of the drawing with the same name. The same
process as the current drawing, are preselected in the drawing creation dialog
box that opens by clicking on this icon.
9.6.4.4.
Locate File in the Drawings
Folder
The locate file button (
![]() ),
opens the file explorer with preselected the Excel fie of the drawing
preselected.
),
opens the file explorer with preselected the Excel fie of the drawing
preselected.
9.6.4.5.
Print the Drawing
The print button (
![]() )
allows the user to print out the drawing directly from the drawing viewer. The
resolution and quality of the drawing prints through this button are depending
on the image resolution settings of the program. If higher quality or
resolution of the drawing is required, please open the drawing in Excel and
print out the drawing from print command in the Excel software.
)
allows the user to print out the drawing directly from the drawing viewer. The
resolution and quality of the drawing prints through this button are depending
on the image resolution settings of the program. If higher quality or
resolution of the drawing is required, please open the drawing in Excel and
print out the drawing from print command in the Excel software.
9.6.4.6.
Delete the Drawing
The delete button (
![]() ),
irreversibly deletes the drawing from the project drawings folder. So, please
use this button when you deliberately intend to delete a drawing.
),
irreversibly deletes the drawing from the project drawings folder. So, please
use this button when you deliberately intend to delete a drawing.
9.7. Process Viewer
Process viewer